

In September 2018, the United States launched the largest tariff campaign in modern history. Twenty-five percent on $200 billion of Chinese goods, eventually covering more than $300 billion in imports. The pretext was to force manufacturing back to America, shrink the trade deficit, and punish China for its trade practices.
The campaign was built on a story: China's weak yuan and suppressed wages constituted an assault on American workers. The trade deficit was the wound. In this telling, America was the victim of foreign aggression, and tariffs were the righteous response.
Six years later, the results are in.
The bilateral goods deficit with China has fallen, from $375 billion in 2018 to roughly $295 billion in 2024. Politicians claimed victory. But the overall U.S. trade deficit with the world has grown to a record $1.2 trillion.1 The deficit didn't shrink; it rerouted. Assembly shifted from Shenzhen to Ho Chi Minh City, from Guangdong to Monterrey. The flags on the shipping containers changed. The underlying architecture remained untouched.
Apple's supply chain runs through China like blood through arteries. Its products should have been devastated by a 25% tariff. Instead, its market capitalization tripled during the trade war years, surpassing $3 trillion.
The story was wrong. Not because China's practices were benign, but because it identified the wrong cause. The trade deficit isn't something China imposes on America. America has benefitted profoundly from China's rise. It's just that the spoils have accrued to a small minority while the long-term costs were born by the majority. And this is a natural consequence of four decades of policy choices rooted in a specific ideology: the belief that markets will allocate resources efficiently without guidance, that corporations exist to maximize shareholder value, and that capital should flow freely across borders.
It boils down to this: China offered cheap labor. American corporations took the deal. Not because they were forced to, but because the ideology governing them demanded it.
This paper describes how America's obsession with markets provided ideological cover for a specific tradeoff: corporations would exploit global labor arbitrage to maximize shareholder returns, and the costs (hollowed industries, weakened state capacity) would fall on everyone else. The nationalist framing serves those who profited from that architecture, directing anger at Beijing rather than at the American boardrooms and policy choices that made it possible.
My thesis should not be confused with Triffin's Dilemma; the idea that the US bears an "exorbitant burden" as issuer of the world's reserve currency, and that it must run deficits to supply global liquidity. This imbalance is mechanical, yes. But Triffin explains why the US can sustain deficits without crisis. It does not explain who profits from this arrangement, or why American policymakers chose to let them. This essay does: Dollar hegemony is the permissive condition. Market fundamentalism is the cause.
Illuminating this requires tracing how ideology became architecture: how the belief that corporations exist to maximize shareholder value became a machine that extracts value from workers on two continents. The destination is always the same: the portfolios of the 10% of American households that own 90% of stocks.
Last month, I argued that the U.S. trade deficit isn't something that happens to America; it's something U.S. corporations do.2 That was the diagnosis. Now I have the blueprints.
A new academic paper, Chen et al.'s "The Hidden Role of Multinational Corporations in the U.S.-China Trade Conflict," traces exactly how the machine was built.1 Combined with recent capital allocation research from Morgan Stanley, we can now form a more complete sketch of the circuit: from factory floor to Wall Street buyback announcement.3
Consider what Chen et al. identify as the telltale signature: S&P 500 multinationals sell nearly half their products abroad, yet book barely a quarter of their profits there. Meanwhile, manufacturing assets in China comprise just 0.93% of consolidated corporate assets.1
The gap isn't inefficiency; it's extraction. Profits are being systematically separated from the places where products are made and sold, then channeled through a carefully constructed architecture to where they can be most advantageously recorded and distributed to shareholders.
Chen et al. call this the "corporate circuit of value."1 I call it the Arbitrage Engine: the machine American ideology built for the few to dominate the many.
This isn't the age-old tale of offshore tax optimization. That's part of it, but not the most important part. The central argument of this essay is that the lesson of the trade deficit has been inverted and sold by the establishment as America's loss and China's gain. And this lie underpins many of the misguided and dangerous policy decisions that are undermining the foundations of Western society at the moment.
The Map No One Showed You
Traditional trade analysis asks the wrong questions: Where are goods made? and Where are they sold?
Chen et al. ask something different: Where is value captured?1
The answer requires recognizing three distinct geographies that corporations have surgically separated from one another.
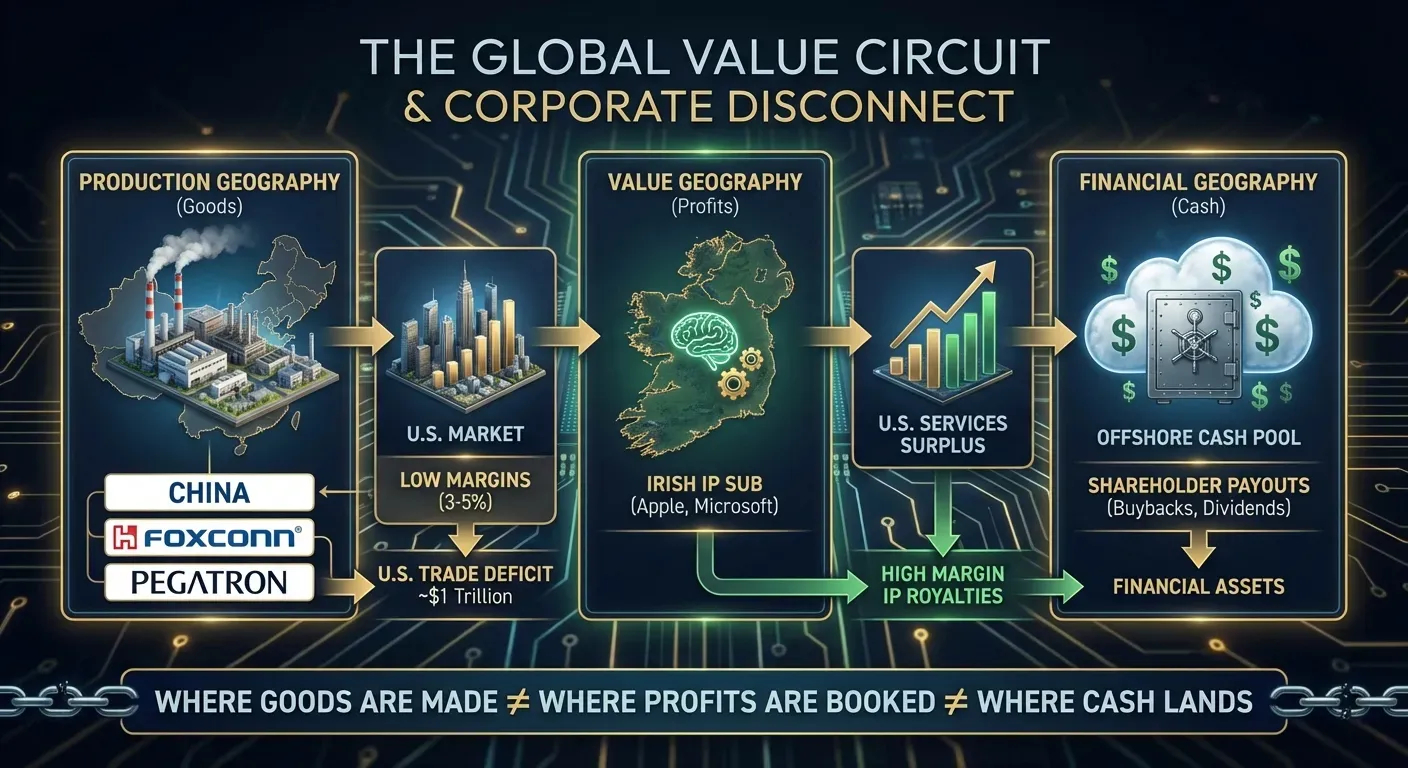
Geography #1: Production. Where goods are physically assembled. This is China, Vietnam, Indonesia, Mexico. It is dominated by contract manufacturers like Foxconn, Pegatron, and Luxshare, companies that operate under cost-plus pricing with margins of 3-5%.1,4
When an assembly worker in Zhengzhou slides an iPhone into its packaging, she is adding real value. She retains almost none of it. But here's what matters: she is not the "enemy" that American politicians denounce. She is an input, her wage set by the same logic of cost minimization that eliminated her American counterpart's job. The ideology that governs American corporations treats both workers identically: as costs to be minimized, not stakeholders to be considered.
The suppressed wages in Shenzhen are not a Chinese weapon aimed at America. They are an opportunity that American corporate ideology was designed to exploit. Every developing country offers cheap labor. The question is why American policy made it so profitable for American corporations to take that offer and return so little to American workers and communities.
Geography #2: Value Capture. Where profits are actually recorded. This is U.S. headquarters, Irish subsidiaries, Dutch holding companies, Luxembourg shell entities. It is determined not by who builds the product but by who owns the intangible assets: the patents, the brands, the software, the designs.
An Irish subsidiary can employ a few hundred people yet book billions in profits from sales across entire continents. High margins, minimal physical presence. The magic isn't in the manufacturing. It's in the legal architecture that assigns ownership of value to wherever taxes are lowest.
Geography #3: Financial Distribution. Where accumulated cash is managed and deployed. This is offshore cash pools in tax-advantaged jurisdictions, invested in money market funds, corporate bonds, and Treasury securities, before eventually finding their way to the final destination: U.S. financial markets via dividends and buybacks.
When a CEO announces another hundred billion in share repurchases, they are completing the circuit. The value that began as labor in Zhengzhou ends as returns in Greenwich.
Here is the critical insight: these three geographies have been deliberately decoupled, not by China, but by American corporations following the logic of an American ideology.
Production happens in China. Profits land in Ireland. Cash flows to Wall Street.
This decoupling is the missing link in traditional trade analysis:
The trade deficit measures flows in Geography #1.
Corporate profits measure flows in Geography #2.
Stock prices reflect flows in Geography #3.
Policymakers stare at Geography #1 and wonder why tariffs don't work. They don't work because value capture happens in Geography #2, and the money escapes through Geography #3. The tariff is a Geography #1 intervention on a Geography #2 architecture built by Geography #3 incentives.
You cannot solve an American ideology problem with a China tariff.
Figure 1: The Corporate Disconnect. Production happens in China through contract manufacturers like Foxconn and Pegatron. Profits are booked in Irish IP subsidiaries. Cash accumulates offshore before flowing to shareholders. The trade deficit measures only the first geography; the arbitrage lives in the other two.
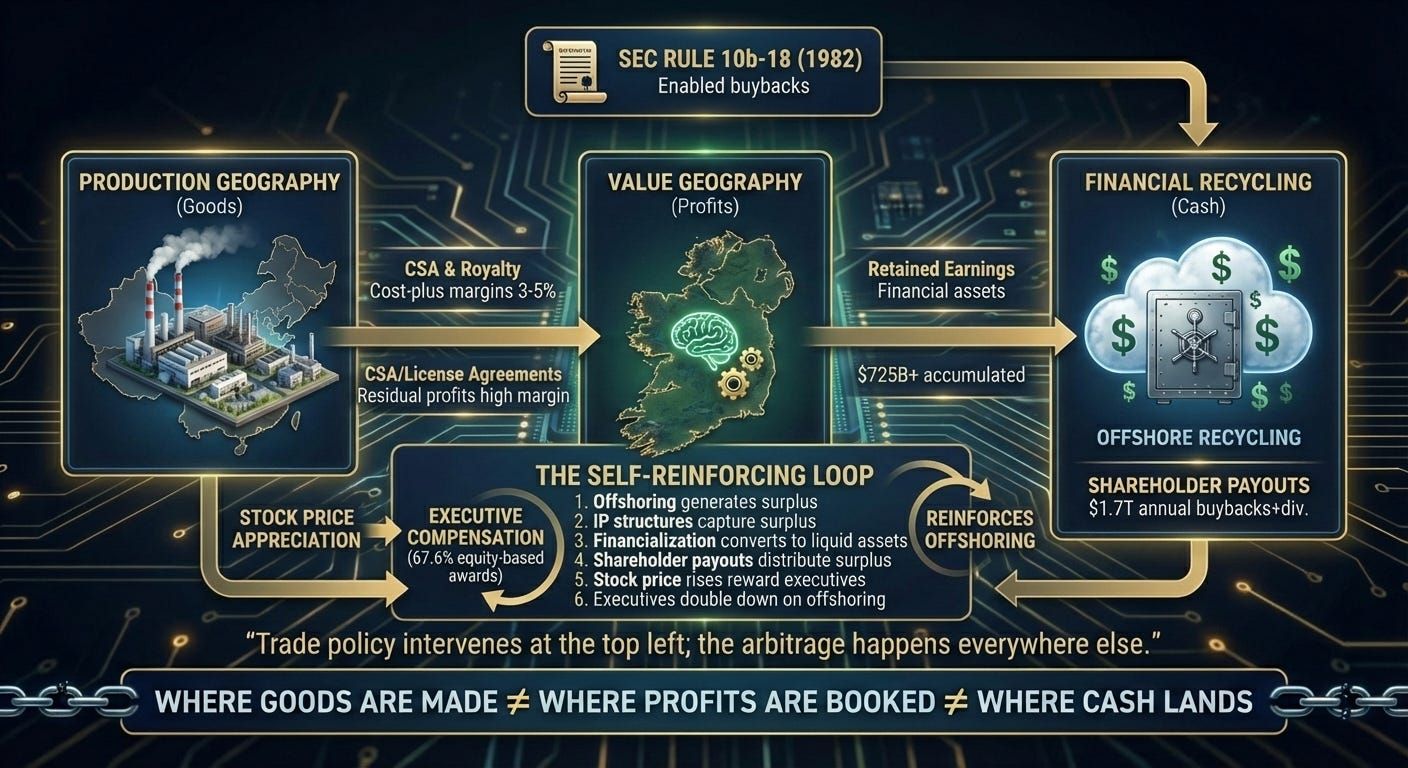
Source: Author's conceptual illustration.
How the Machine Was Built
This architecture did not emerge from market forces alone. Markets operate inside legal and governance frameworks. The architecture was constructed through deliberate American choices, assembled piece by piece over four decades until the machine had captured the legal and governance architecture that once contained it.
Understanding who built the machine reveals who can dismantle it.
The first piece was permission.
In 1982, the Securities and Exchange Commission adopted Rule 10b-18, creating a "safe harbor" for stock repurchases. Before that rule, buybacks existed in legal ambiguity: they looked too much like market manipulation, like a company bidding up its own stock. After 1982, the ambiguity vanished.
Over the following decades, net buybacks (repurchases minus issuance) grew from near-zero to more than $800 billion annually.5 The SEC had built the exit ramp. It would take corporations a generation to realize that everything could fit on it: profits, productivity gains, the surplus of an entire economy.
Figure 2: The 1982 Turning Point
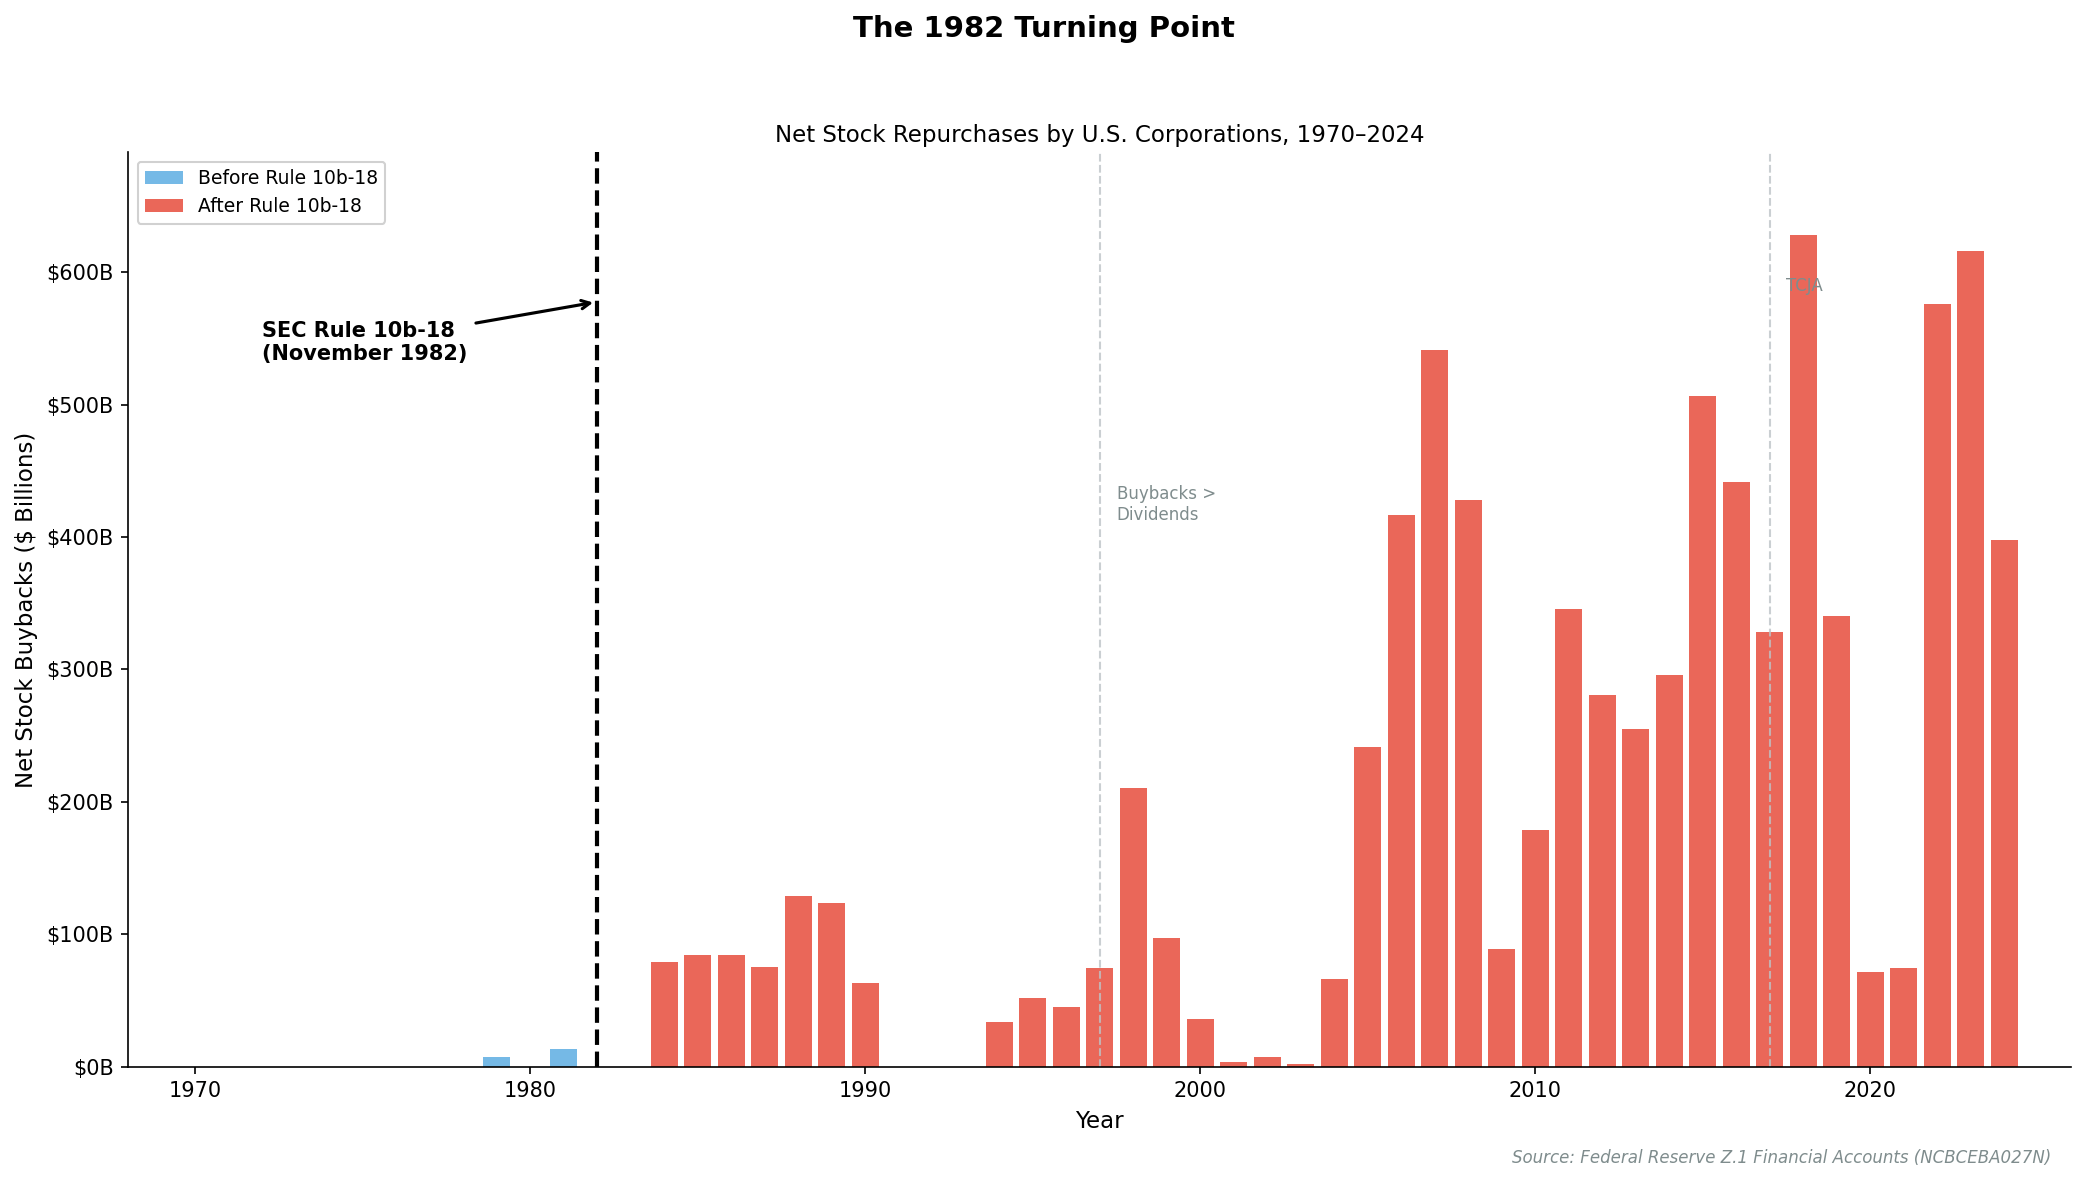
Source: Federal Reserve Financial Accounts (Z.1), Series NCBCEBA027N. Net equity transactions show corporate buybacks minus issuance.
This was an American policy choice.
The second piece was ideology.
Throughout the 1990s, "shareholder value maximization" spread from business school classrooms to boardrooms to activist investor manifestos, becoming the dominant creed of American corporate governance. The idea was simple: corporations exist for one purpose, to maximize returns to shareholders. All other stakeholders (workers, communities, suppliers, the nation itself) were secondary considerations at best.
Executive compensation shifted toward equity-based awards: stock options and restricted shares that tied personal wealth directly to stock price. The metric of corporate success became the metric of shareholder returns.6 Managers now had powerful personal incentives to use that exit ramp, and to structure their companies to generate as much surplus as possible to send down it.
This was an American ideological choice.
The third piece was the cost platform.
In 2001, China entered the World Trade Organization. This gave American corporations access to a vast low-cost manufacturing base through what trade economists call "processing trade": arrangements where components are imported, assembled, and re-exported with minimal domestic value-added.
China offered something American corporations wanted: cheap labor, minimal regulation, and scale. American corporations took the deal enthusiastically. This was not a defeat. It was a choice, made by corporate leaders operating under an ideology that valued cheap inputs over domestic production, shareholder returns over worker welfare, quarterly earnings over long-term industrial capacity.
The arrangement enabled a new model: design in California, manufacture in Shenzhen, ship to the world. Companies could become "asset-light," shedding the factories and workers that had defined industrial corporations for a century.3,7
This was an American strategic choice.
The fourth piece was the legal architecture.
Through the 2000s and 2010s, cost-sharing agreements matured into precision instruments for profit allocation. Irish subsidiaries became principal profit centers. Tax structures with names like the "Double Irish" (arrangements that routed profits through Irish and Dutch entities to reach tax-free Caribbean endpoints) proliferated across multinational networks.1
Transfer pricing (the art of setting prices for transactions between related entities in different countries) was optimized to shift profits to low-tax jurisdictions while keeping costs in high-tax ones. These arrangements were invisible to customs officials and impervious to tariffs. They were the pipes that moved value from Geography #1 to Geography #2.
This was an American legal and tax policy choice.
The fifth piece was enforcement.
The IP rents that flow through Irish subsidiaries aren't self-executing. They depend on foreign governments respecting American intellectual property claims. The U.S. government made sure they would. Through the USTR's Special 301 process, Washington threatens trade retaliation against any country that fails to protect American patents, trademarks, and copyrights.
The TRIPS agreement, pushed through the WTO in 1995, globalized American-style IP protection as a condition of market access. Bilateral trade deals include ever-stronger IP chapters.
The U.S. government doesn't merely permit the arbitrage; it actively enforces the rent extraction abroad.
This was an American policy choice.
By the mid-2010s, the pieces had fused into a complete system: offshore production for cheap inputs, centralized IP ownership for value capture, tax-optimized profit booking for minimal leakage, and programmatic distribution to shareholders.
Pay attention to the chronology: the extraction infrastructure preceded the cost platform by two decades. Buyback authority and shareholder primacy created a system hungry for surplus before China offered the means to generate it. The machine was built waiting for fuel. China's WTO entry didn't create the extraction logic; it supercharged it. This sequencing is precisely why tariffs fail: they target the fuel source while leaving the engine untouched.
Each piece was built for its own purpose, by its own constituency, in its own decade. No one drew the master blueprint. But blueprints aren't necessary when everyone in the decision matrix shares the same definition of "better." The SEC, the business schools, the trade negotiators, the tax lawyers—all were optimizing for shareholder returns, each in their own domain. The pieces didn't need to be coordinated. They just needed to be compatible. And an ideology that reduces all value to one metric produces exquisitely compatible parts.
The ideology said: corporations exist to maximize shareholder value. The architecture said: here's how. The government said: we'll protect it.
The Value Capture Channel
The engine runs on a single fuel: the siphoning of value out of physical production and into intellectual property.
Among leading technology and pharmaceutical multinationals, intangible assets (patents, brands, proprietary algorithms, trade secrets) now comprise more than a third of total corporate assets. These firms spend nearly 10% of annual revenue on R&D. And their domestic divisions, where the intangibles are housed, earn gross margins 8.5 percentage points higher than their foreign counterparts.1
This differential isn't because foreign operations are inefficient. It's because the high-margin functions (design, branding, software development, patent creation) are retained at headquarters while the low-margin functions (assembly, logistics, physical manufacturing) are pushed offshore. The corporation has split itself in two: a brain that captures rents and a body that performs labor.
Increasingly, the body doesn't even belong to the same corporate organism. The factories are contractors. The workers are someone else's employees. The legal separation insulates the brand from the sweatshop.
The value flows back through two channels.
The first is intra-firm licensing. When Foxconn assembles an iPhone, it earns a contract manufacturing fee, perhaps $20 per unit on a device that retails for $1,000. But embedded in that iPhone are thousands of patents, a globally recognized brand, and an operating system that took billions to develop. The legal ownership of those intangibles sits not in Shenzhen but in entities controlled by Cupertino. For every iPhone sold anywhere in the world, licensing fees flow from the point of sale back to the IP-holding entity. The factory captures the cost-plus margin of physical assembly. The IP holder captures the residual: the difference between what consumers will pay for an Apple phone versus a generic smartphone with identical specs. That residual is where the real money lives.
The second is cost-sharing agreements. These are more sophisticated, and more lucrative. Rather than simply licensing IP from headquarters, a foreign subsidiary pays to co-develop the intellectual property. In exchange, it receives "economic ownership" of that IP for entire regions: Europe, the Middle East, and Asia-Pacific. The buy-in price is negotiated when the agreement is signed, based on the projected value of the IP at that moment.
Here's where the magic happens: if the IP becomes wildly successful, the subsidiary keeps all the upside. Apple's Irish subsidiary paid to co-develop iOS and the iPhone platform in the mid-2000s, when their value was speculative. A decade later, that subsidiary was booking the profits on hundreds of billions in sales across three continents, profits that reflected the actual value of the platform, not the projected value locked in years earlier. The cost was fixed at sign-up; the profits were unlimited. The IRS has challenged these arrangements, but when structured carefully, they're legally defensible. They're not loopholes. They're the architecture working as designed.
The macro signature of this system is unmistakable. Between 2000 and 2024, U.S. receipts from IP licensing surged from $43.5 billion to $170 billion. The net balance quadrupled from $27 billion to $116 billion.1
But here is what matters most: over 60% of these inflows originate from payments by foreign affiliates of U.S. multinationals, not arm's-length transactions with independent foreign clients.1 American companies are paying themselves, and calling it international trade.
There's a comforting story told about these numbers: America runs a goods deficit because we've moved up the value chain. We don't make things anymore; we design them, brand them, license them. The services surplus proves it.
But over 60% of those "service exports" are American companies paying themselves. The services surplus isn't evidence of competitiveness. It's the accounting echo of corporate rent extraction: value captured through legal fictions, recorded as trade.
The Intangible Pivot
Critics sometimes object: But companies are investing. Look at R&D spending!
This objection, properly understood, proves the thesis.
Over the past fifty years, R&D as a percentage of sales has roughly doubled, from around 2% in the 1970s to nearly 4% today.3 Meanwhile, physical capital expenditure has collapsed.
Companies didn't stop investing. They changed what they invest in.
And that change wasn't neutral. It was ideological and structural.
Capital expenditure builds factories. Factories create jobs, anchor communities, and generate the engineering knowledge that compounds across generations. But factories have a property that makes them unattractive under shareholder value logic: they are fixed. A factory in Ohio produces goods in Ohio, generates income in Ohio, and pays taxes in Ohio. The profits cannot be routed through Dublin or Luxembourg. They are earned where the machinery sits.
R&D builds intellectual property. And intellectual property has the opposite property: it is frictionlessly mobile. A patent can be legally relocated to any jurisdiction the corporation chooses, with nothing more than paperwork and a cost-sharing agreement. The formulas, the code, the brand identity remain controlled from headquarters. But the profits they generate can be booked wherever tax treatment is most favorable.
This asymmetry tilts the investment calculus. Profits from a domestic factory face full U.S. taxation, with limited ability to route value through offshore subsidiaries. But build that same factory abroad, pair it with IP housed in Ireland, and the after-tax return transforms. Every prospective U.S. capital investment must clear not just its cost of capital but a higher effective hurdle rate, competing against alternatives where the same investment yields substantially more after-tax profit.
The tax code doesn't prohibit domestic investment. It just makes offshore investment more rewarding. When executives are compensated in stock, when their mandate is to maximize shareholder value, when every quarterly earnings call is an accounting of how efficiently capital has been deployed, they make the rational choice. They build the factory in Shenzhen and the IP holding company in Cork.
The factory is an anchor. The patent is a kite that goes wherever the wind is favorable.
Figure 3: The Intangible Pivot. The blue line shows net capital expenditure (capex minus depreciation) as a percentage of sales. The red line shows intangible investment (SG&A plus R&D) as a percentage of sales. Net physical investment collapsed from 5% to 1.5% of sales while intangible spending rose from 10% to 14%. The shaded gap represents the reallocation.
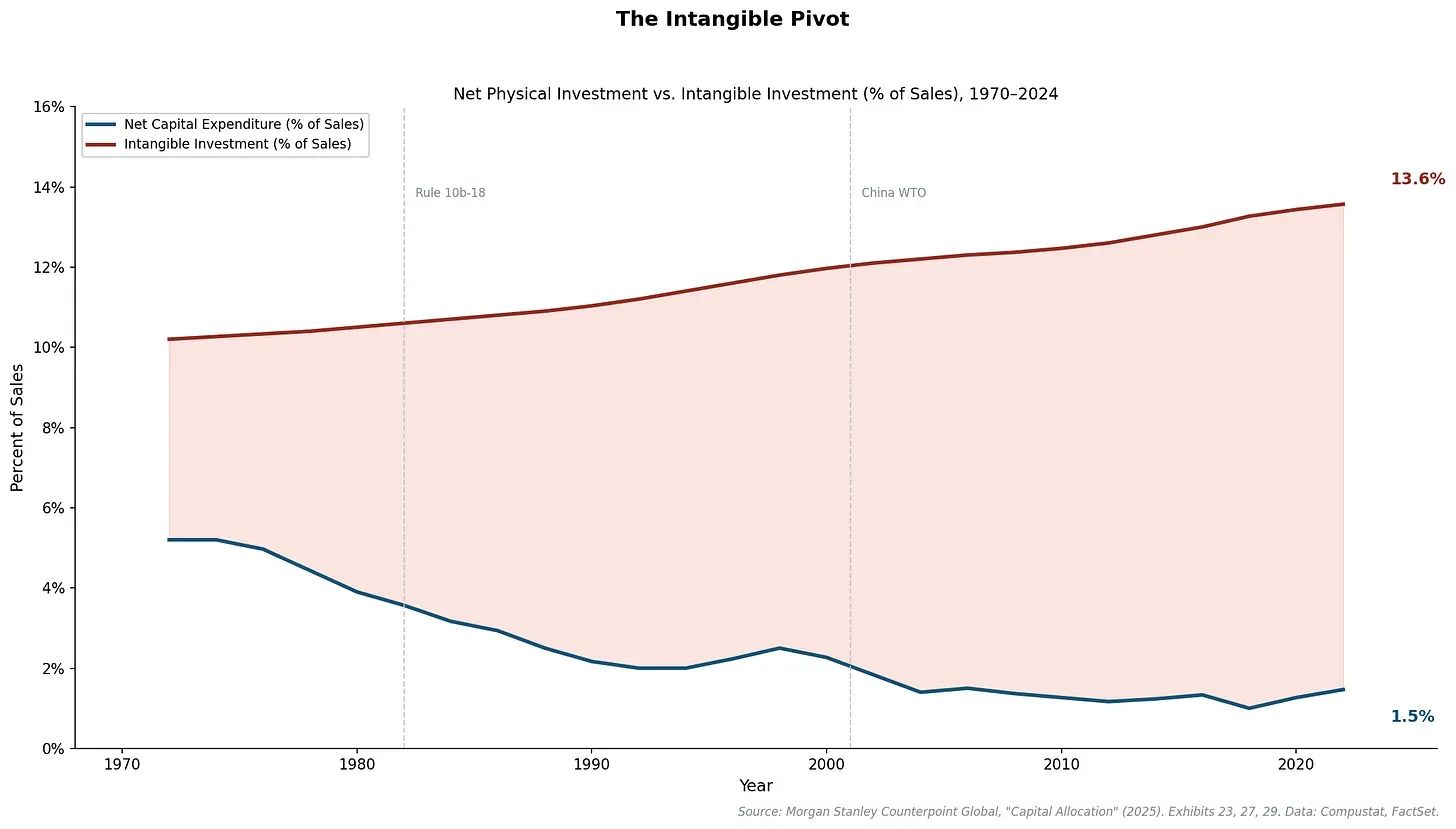
Series construction: Net CapEx from Exhibit 27; Intangible Investment (SG&A ex-R&D plus R&D) from Exhibits 23 and 29. All as percentage of sales for U.S. public companies. Source: Morgan Stanley Counterpoint Global, "Capital Allocation: Results, Analysis, and Assessment" (2025). Underlying data: Compustat; FactSet.
The chart shows where corporate investment actually went. Net capital expenditure, which measures investment that expands physical productive capacity after accounting for depreciation, fell from roughly 5% of sales in the early 1970s to just 1.5% today. Intangible investment (software, brands, customer acquisition, R&D) rose from 10% to nearly 14%.
The gap between the lines represents a choice. Corporations didn't stop investing; they redirected investment from physical capacity to intellectual property. They kept the high-margin activities (design, brand, software) and offshored the low-margin ones (assembly, logistics, manufacturing). This wasn't forced on them. It was the economically rational response to an incentive structure that America built for itself.
Figure 4: The American Exception
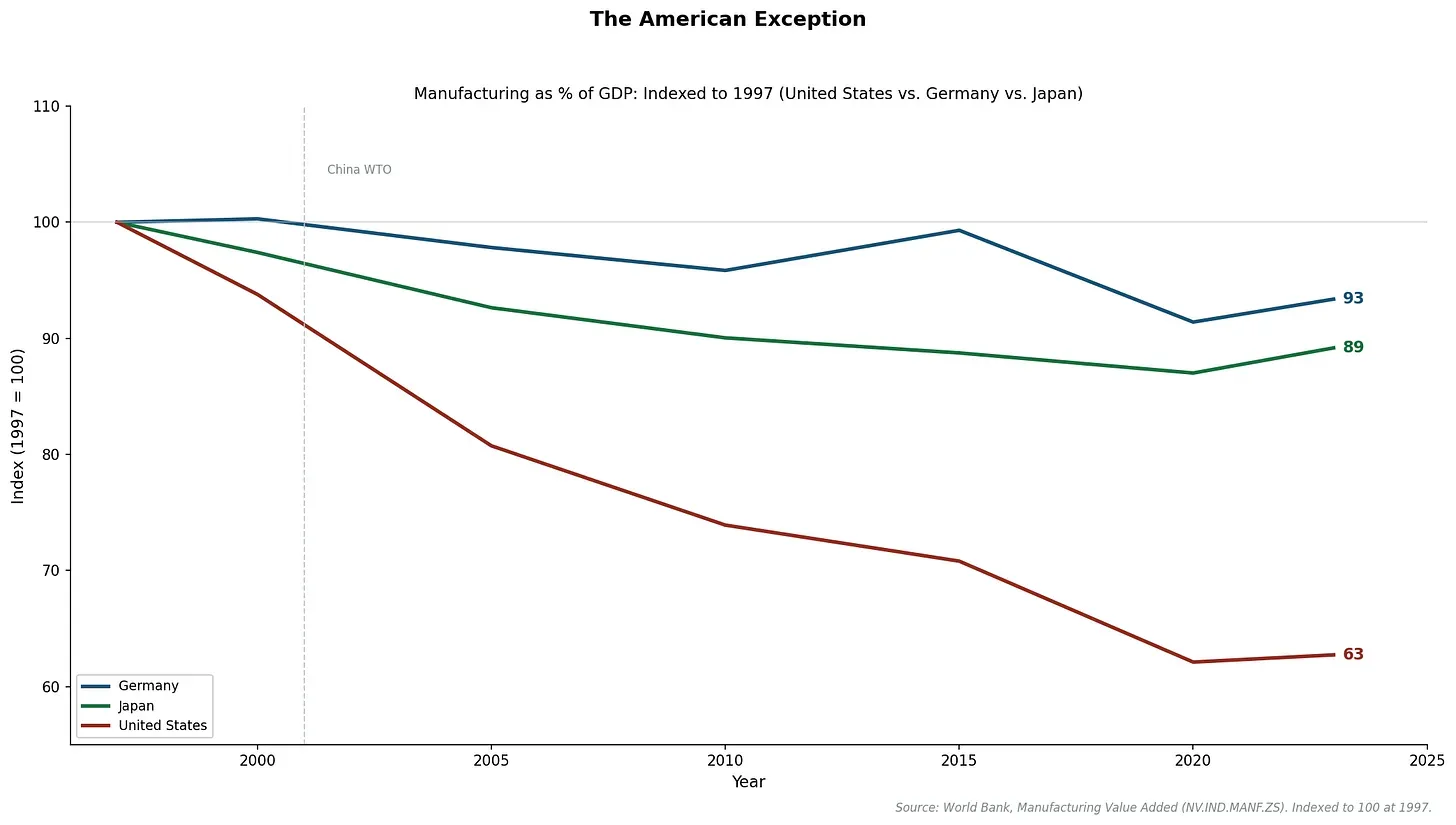
Source: World Bank, Manufacturing Value Added (% of GDP), Series NV.IND.MANF.ZS. Indexed to 1997.
The international comparison makes the point undeniable. Companies in Germany and Japan faced similar competitive pressures (the same cheap labor in China, the same containerized shipping revolution) but operated under different governance frameworks. They made different choices because their institutions permitted different choices. The comparison doesn't prove ideology alone explains outcomes; it proves that governance structures constrain what 'rational' means. American deindustrialization was the rational response to American institutions—institutions that could have been designed differently.
This choice had consequences. Something left with the factories that wasn't captured on any spreadsheet: the engineering knowledge that accumulates on production lines, the supplier ecosystems that enable rapid iteration, the workforce skills that compound across generations. The financial logic was impeccable. The industrial consequences were not part of the calculation, because the ideology said they didn't need to be.
The Financial Transformation
The profits captured through these IP structures don't immediately return to the United States. They accumulate in offshore entities, legally foreign but strategically controlled by U.S. parents.
The scale is large. As of 2024, major U.S. multinationals still held approximately $725.7 billion in accumulated offshore earnings, a figure that has rebuilt substantially since the 2017 repatriation wave. Effective corporate tax rates fell from 40.1% in 1990 to 22.95% in 2024. Cash and marketable securities on corporate balance sheets rose from 7.9% to 12.4% of total assets. Financial income (interest, dividends, and gains from financial investments) now constitutes nearly 39% of operating profits, up from 31% three decades ago.1
Chen et al. make an important observation: this offshore cash isn't "trapped." It isn't sitting idle in Irish bank accounts, waiting for a tax holiday. It is actively deployed in financial markets, invested in money market funds, corporate bonds, U.S. Treasury securities, short-term commercial paper.1
The multinational corporation has become a financial intermediary: generating surplus from the spread between foreign manufacturing costs and global selling prices, then deploying that surplus not into new factories but into capital markets. It borrows cheaply in the United States, using its offshore hoard as implicit collateral, to fund operations and shareholder payouts without triggering repatriation taxes. It earns interest and dividends on its financial investments.
This represents a fundamental transformation in the role of the corporation, a transformation that shareholder value ideology not only permitted but demanded.
For most of the twentieth century, the corporation was capitalism's circulatory system: the pumping heart that moved savings into factories, factories into wages, wages into consumption, consumption back into savings. Households saved money. Banks and capital markets channeled those savings to corporations. Corporations borrowed and invested in productive capacity: factories, equipment, research facilities. Investment created jobs and output. Workers earned wages and bought products. The cycle repeated.
Around 2000, the polarity reversed.
Corporations became net lenders rather than net borrowers, generating more surplus than they could profitably invest, or perhaps more than their ideology allowed them to invest. The excess no longer flowed into productive capacity. It recycled into financial markets.
Look at the chart. The red bars show the old world: corporations borrowing to build, drawing capital from financial markets to fund expansion. The green bars show the new world: corporations lending to financial markets, generating more cash than they invest productively. By the 2010s, corporate net lending averaged more than 3% of GDP annually.
Figure 5: The Regime Change. Before 2000, corporations were net borrowers (red bars), drawing capital from financial markets to fund expansion. After 2000, they became net lenders (green bars), generating more surplus than they deployed productively. The average swung from -1.6% of GDP to +2.7%. The corporation stopped being capitalism's circulatory system and became its extraction mechanism.
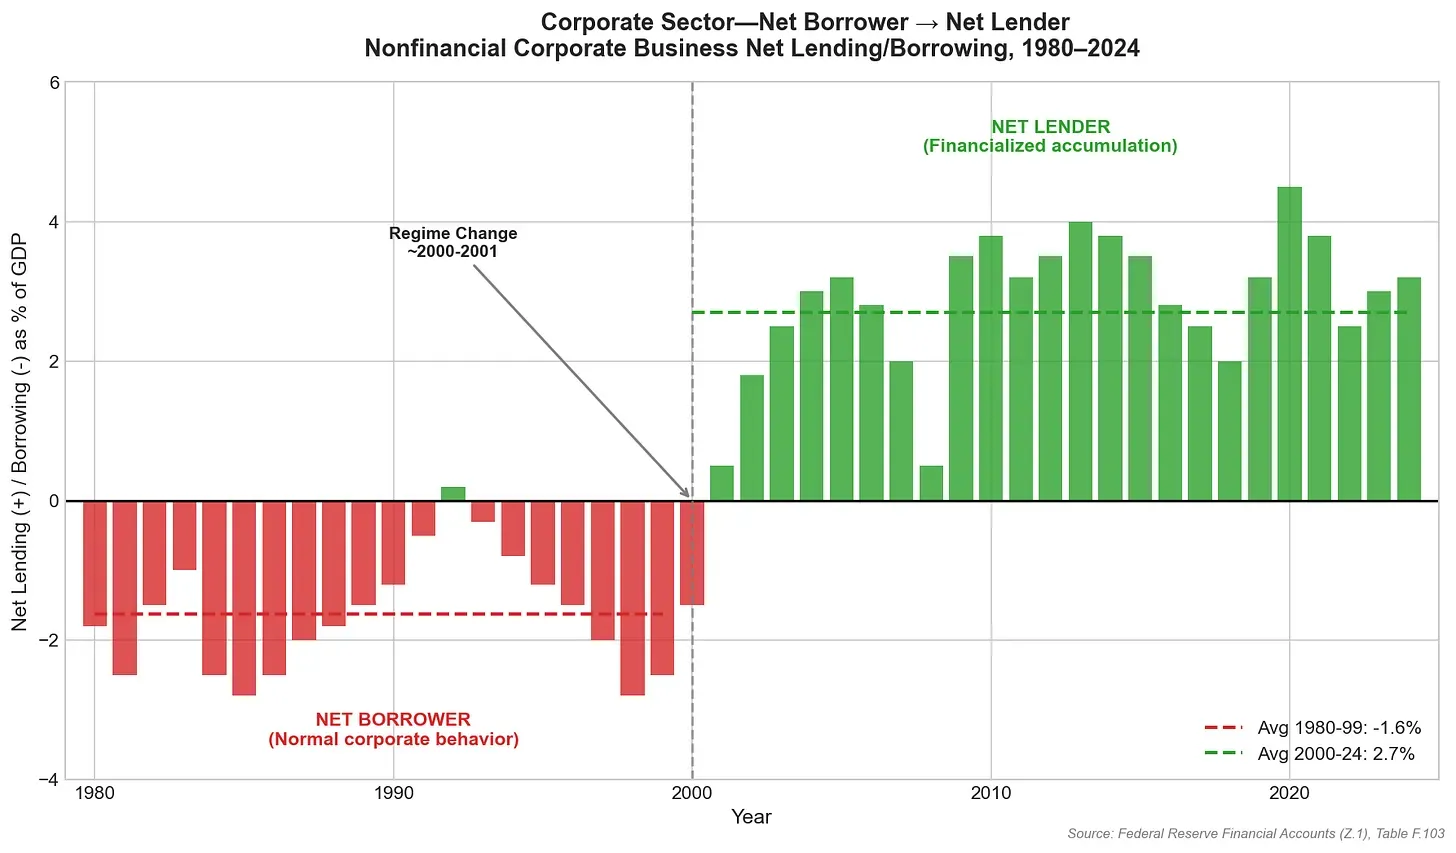
Source: Federal Reserve Financial Accounts (Z.1), Table F.103.
This inversion severed the link between corporate profits and productive investment. The circuit no longer runs through factories and workers. It runs through financial assets and shareholders. The corporation stopped being a bridge between savers and builders. It became a toll booth between labor and capital.
The 2017 Tax Cuts and Jobs Act offers a natural experiment. The law imposed a transition tax on accumulated foreign earnings and shifted to a territorial system explicitly designed to encourage repatriation. Bring the cash home, the argument went, and corporations will invest in American workers and American factories.
The cash came home. The investment didn't come with it.
Repatriated funds went disproportionately to buybacks and dividends; multiple studies found that the bulk of repatriated cash funded shareholder payouts rather than domestic capital investment.1 The TCJA proved the point definitively: you can move the cash, but you cannot change the logic of accumulation. The preference for financial deployment over productive investment isn't a response to tax incentives or capital costs. It's ideological, embedded in how corporations are governed, the relative attractiveness of extraction over production, and how executives are compensated.
The ideology says: maximize shareholder value. The architecture says: here's the money. The outcome is inevitable.
The Shareholder Endpoint
We can now follow the money to its final destination.
In 2024, S&P 500 firms distributed approximately 37% of net income as dividends and another 53% through stock buybacks.3 Add them together: corporations returned roughly 90 cents of every dollar earned to shareholders. Total buybacks alone reached $679.3 billion. The payout-to-capex ratio (how much corporations return to shareholders relative to how much they invest in their own productive capacity) has exceeded 1.0 for most years since the mid-2010s.1
Dividends and buybacks are functionally equivalent as mechanisms for returning cash to shareholders: both extract resources from the corporate balance sheet, both enrich owners at the expense of reinvestment. Public discourse fixates on buybacks specifically because they offer shareholders a tax advantage, because they provide executives more flexibility, and because concentrated corporate buying pressure may inflate valuations. But the core phenomenon is shareholder payouts as a category, not buybacks in isolation.
The total payout ratio is the signature of an economy in harvest mode. Corporations are extracting more value than they are seeding.
Figure 6: The Substitution. The blue line shows cyclically adjusted net capital expenditure as a percentage of net income. The red line shows cyclically adjusted net shareholder payouts. In the late 1970s, corporations invested nearly 100% of net income and paid out just 27%. By 2019, the ratios had completely inverted: investment fell to 28% while payouts rose to 81%. The lines crossed in 1992. Corporations now pay shareholders three dollars for every dollar they invest.
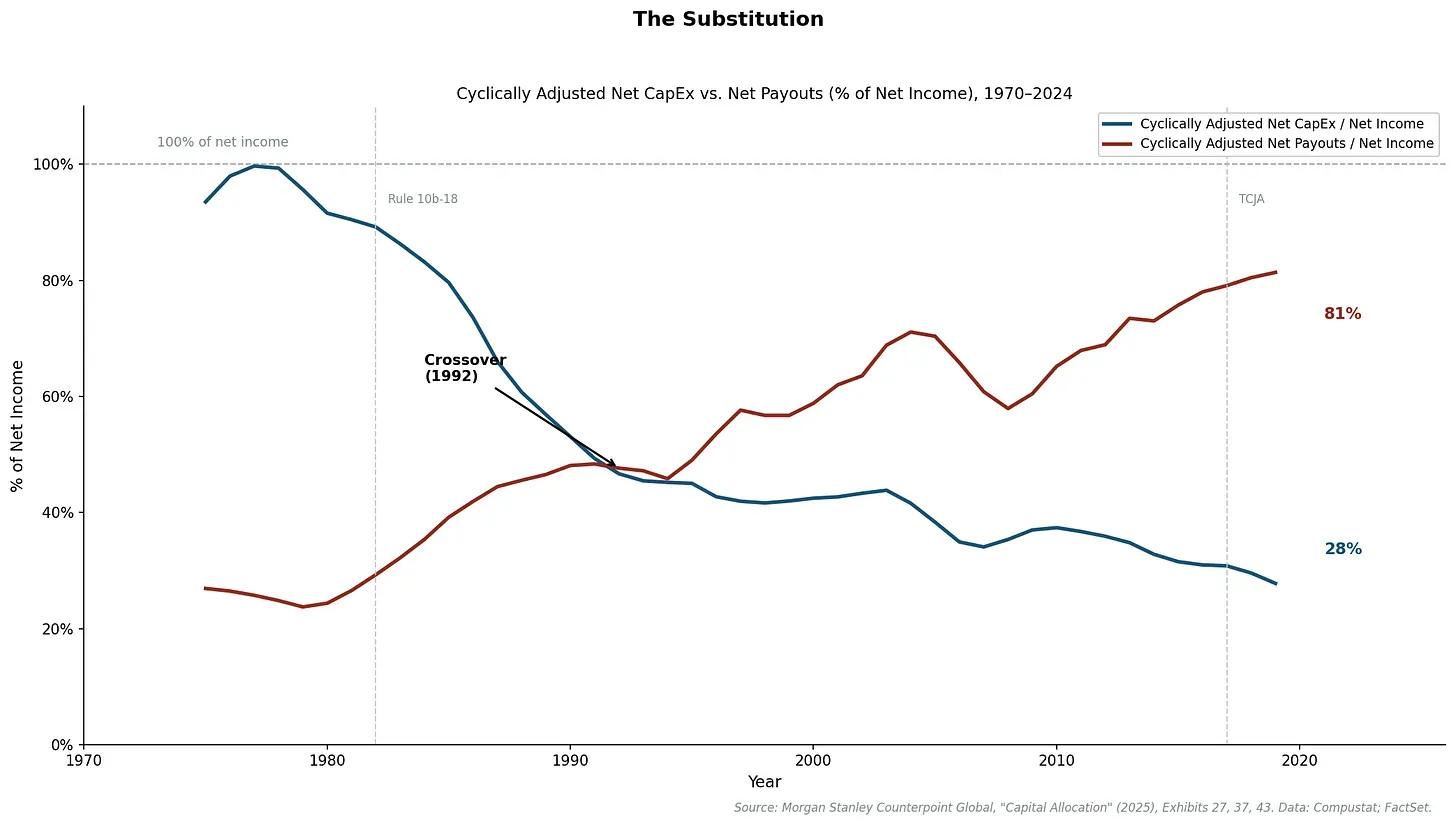
Series construction: Net CapEx (capital expenditures minus depreciation) extracted from Morgan Stanley Exhibit 27; Net Payouts (dividends plus net share buybacks as percentage of net income) from Exhibit 43. Net income imputed from dividend amounts and payout percentages in Exhibit 37. Both series smoothed using 10-year centered moving averages to remove cyclical distortions from recession years when profits collapsed but distributions continued. Source: Morgan Stanley Counterpoint Global, "Capital Allocation: Results, Analysis, and Assessment" (2025). Underlying data: Compustat; FactSet.
The chart speaks for itself. After accounting for depreciation (the wearing out of existing capital), net capital expenditure has fallen from nearly 100% of net income in the 1970s to just 28% today. Corporations now invest barely a quarter of their profits in expanding productive capacity. The rest flows to shareholders.
The gap between the lines represents hundreds of billions of dollars annually flowing out of productive enterprise and into financial markets. The economy is being harvested, not cultivated.
Figure 7: The Cumulative Drain
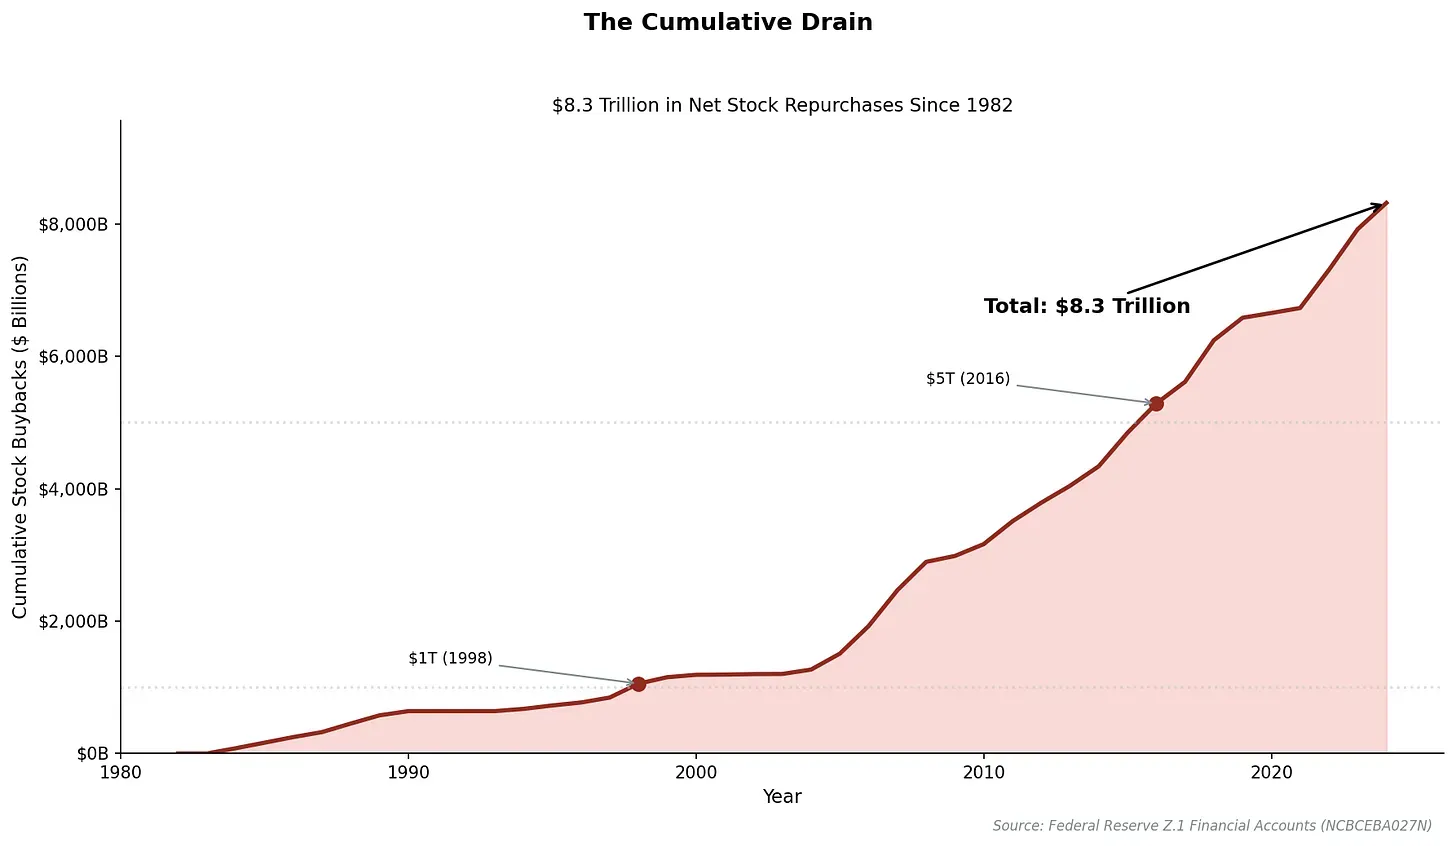
Source: Federal Reserve Financial Accounts (Z.1), Series NCBCEBA027N. Cumulative net equity transactions (buybacks minus issuance) since SEC Rule 10b-18.
The cumulative scale is staggering. Since 1982, when the SEC created the legal safe harbor for buybacks, corporations have extracted over $8 trillion more than they raised in equity markets. This is not investment returning to shareholders. It is the systematic liquidation of corporate America into financial assets.
Why do corporations behave this way?
The answer lies in how corporate executives are compensated, compensation structures that are themselves the product of shareholder value ideology.
Since 1978, CEO pay has grown by more than 1,000%, compared to just 24% growth for typical workers. The gulf is even starker over a longer horizon: the CEO-to-worker pay ratio has expanded from 21-to-1 in 1965 to 281-to-1 today. A chief executive earns more before lunch on the first Monday of the year than a typical worker earns by December.8
And the composition of that pay matters: equity-based awards (stock options and restricted shares) constitute over 60% of total executive compensation.1
Figure 8: The Incentive Structure
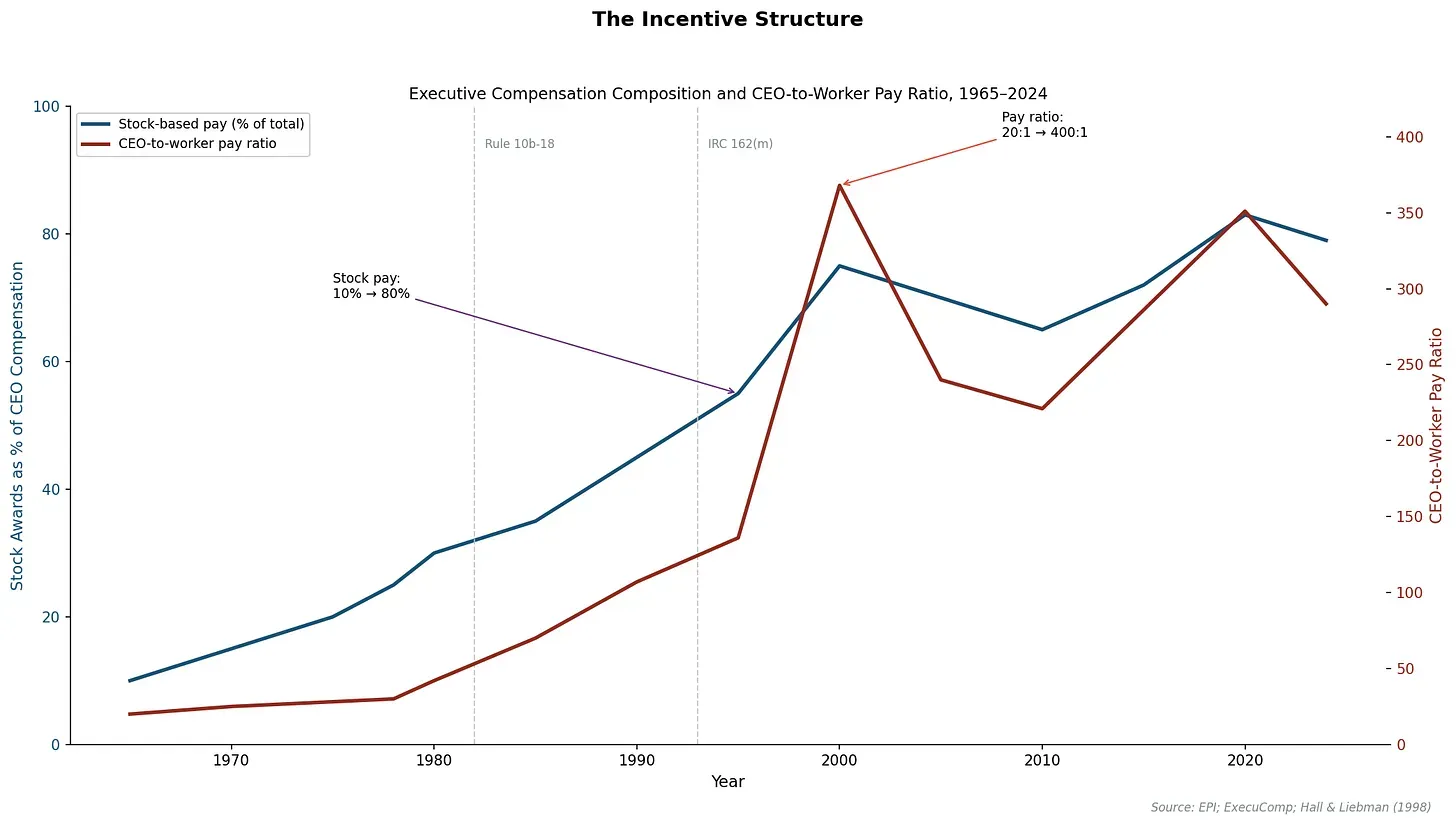
Source: Economic Policy Institute CEO Compensation data; ExecuComp.
Managers are paid primarily in stock. Stock prices respond to earnings per share. Buybacks mechanically boost EPS by reducing the share count: the same earnings divided by fewer shares yields a higher number. The arithmetic is elementary. The incentives are irresistible.
Some observers wonder why markets don't "see through" this financial engineering, why investors reward EPS growth driven by buybacks rather than discounting it. The answer is that markets price what matters to shareholders: returns. Buybacks deliver returns reliably, through higher EPS, through support for stock prices, through concentrated ownership for those who hold. Whether the underlying business is growing becomes secondary to whether the distributions continue. The market has adapted to reinforce the ideology.
This creates a self-reinforcing cycle. Offshoring generates surplus through the spread between foreign costs and domestic prices. IP structures capture that surplus in favorable jurisdictions. Financialization converts the surplus to liquid assets. Shareholder payouts distribute the surplus to owners. Stock price rises reward executives. And executives, thus rewarded, double down on the same strategies to generate more surplus.
The machine feeds itself. And the ideology that built it ensures no one at the controls has any incentive to turn it off.
The Complete Circuit
The pieces now fit together into a single, coherent machine.
Figure 9: The Corporate Circuit of Value
Source: Author's synthesis of Chen et al. (2025) and Mauboussin/Callahan (2025).
The diagram tells the complete story. Value flows from production through IP capture through financial distribution to shareholders, and the cycle reinforces itself. Executives compensated in stock have every incentive to offshore more production, capture more rent, distribute more cash. The circuit closes. Value in, shareholders out.
This framework explains apparent paradoxes in U.S. economic data:
The large goods trade deficit? Geography #1.
The services trade surplus? Geography #2.
Record shareholder payouts? Geography #3.
The magnitudes are consistent with the thesis. Net imports run approximately $1 trillion annually. Visible IP receipts are $170 billion.1 On the distribution side, S&P 500 shareholder payouts alone exceed $1.1 trillion annually, and across all U.S. public companies the figure approaches $1.8 trillion.3,9
And every piece of this machine was built in America, by Americans, according to American ideology.
Why Tariffs Fail
Tariffs fail before they're even imposed. Not mechanically, but conceptually.
They're premised on the idea that China is the cause of the trade deficit, that foreign practices are the problem to be solved. But China was the opportunity. The cause was domestic: an ideology that told American corporations their only obligation was to shareholders, and a set of policies that enabled them to act on that belief.
You cannot solve an American ideology problem with a China tariff.
Even mechanically, the tariffs fail through three distinct channels, and each traces back to the same ideological root.
First, factories move; ownership structures don't.
When tariffs raise the cost of Chinese imports, corporations shift production. Assembly moves to Vietnam, Mexico, Indonesia, Thailand. The physical goods now enter through different ports, from different countries, subject to different tariff schedules.
But the IP ownership stays in Ireland. The cost-sharing agreements remain in place. The value capture architecture is unchanged. The arbitrage continues with a different Geography #1.
The tariff changed the stamps on the boxes. It did not change who opens them.
Second, corporations defend the spread, not the nation.
When costs rise (whether from tariffs, wages, or materials), corporations face a choice: pass the cost to consumers, absorb it into margins, or push it down onto workers and suppliers.
Under shareholder-value governance, with executives paid in stock and measured by quarterly earnings, one option is unacceptable. Margins are sacred. Workers are not.
The corporation's nationality is a legal fiction. Its loyalty is to the spread, not to the flag. It will defend margins by moving production to Vietnam, by automating jobs in Ohio, by squeezing suppliers in Shenzhen, whatever geography offers the best arithmetic.
This is not a betrayal of American interests. It is the faithful execution of shareholder value ideology. The executives are doing exactly what the ideology says they should do.
The tariff assumes corporations will absorb the cost or reshore production. But the ideology ensures they will do neither. They will find the next-cheapest labor pool, or they will pass the cost to consumers, or they will squeeze wages somewhere else. The spread will be defended.
The 2025 tariffs proved this prediction with unvarnished clarity. The Kiel Institute analyzed over 25 million shipments worth nearly $4 trillion and found that foreign exporters absorbed only 4% of the tariff burden.10 The remaining 96% passed straight through to American importers—consistent with earlier tariff rounds where pass-through generally exceeded 90%. Per the paper, "evidence from the 2018–19 tariffs suggests that most firms pass through cost increases to customers...Consumers are the ultimate bearers of the burden." US customs revenue surged by $200 billion in 2025—a tax paid almost entirely by Americans.
The adjustment mechanism is revealing. When the US imposed a 50% tariff on Brazilian imports, Brazilian exporters did not cut their prices to maintain market share. They shipped less. Indian exporters facing similar tariffs did the same: they held their prices and reduced volume. The tariff didn't squeeze foreign profit margins. It shrank trade flows while American buyers absorbed the cost increases arising from lower supply.
This is precisely how a system optimized for margin protection behaves. Foreign suppliers won't sacrifice profits to preserve American market access. American importers won't sacrifice margins to shield consumers. Each node in the chain defends its spread and passes the cost downstream until it lands on the American household, which holds no power in the arrangement and has nowhere else to push it.
Third, even successful reshoring doesn't change the payout logic.
Suppose a company responds to tariffs by reshoring production to the United States. Suppose it builds new factories in Ohio or Texas, employing American workers at American wages.
What happens to the profits?
Under current governance, the answer is unchanged: shareholder payouts. The TCJA already proved this. Without changing governance incentives, reshoring merely changes where the factory sits. The financial destination remains Wall Street.
The machine doesn't care which workers it extracts from. It cares that extraction continues.
This is why tariffs are a Geography #1 intervention on a Geography #2 problem driven by Geography #3 incentives. They're not wrong because they target China. They're wrong because they target geography when the problem is ideology.
What Would Actually Work
Now that the mechanisms are understood let's explore how we might rewire them.
If the problem is American ideology and American policy, then the solution is American ideology and American policy. Chen et al. suggest several points of intervention, each targeting a different piece of the machine.1
The first is transparency in intra-firm pricing.
Requiring disclosure of transfer pricing methodologies and country-by-country reporting of profits, employees, and physical assets would expose the gap between production geography and value geography. The public would see, for the first time, exactly how much profit is booked in countries where little actual activity occurs, how many billions flow through entities with a handful of employees.
Transparency won't eliminate the arbitrage. But shame is an underrated policy instrument. When Starbucks, Amazon, and Google faced public hearings on their UK tax arrangements in 2012-2013, several voluntarily increased their tax payments despite no legal requirement to do so. Sunlight can narrow margins that darkness permits.
The second is coordinated international taxation of intangible income.
The global minimum tax under Pillar Two, combined with U.S. provisions like GILTI (Global Intangible Low-Taxed Income) and BEAT (Base Erosion and Anti-Abuse Tax), aim to remove the tax advantage of offshore IP entities. If profits are taxed at similar rates everywhere, the incentive to book them in Ireland or Luxembourg evaporates.
The limitation is real: tax competition is a prisoner's dilemma played by nations. Ireland did not become a corporate profit center by accident; it became one by defecting first. Hosting IP entities brought jobs, tax revenue (even at low rates), and economic activity. Every other nation faced the same temptation.
But this is an argument for American leadership, not American passivity. The U.S. can set the floor. Other nations can be pressured to follow.
The third is constraints on buybacks.
Restoring the pre-1982 legal ambiguity around repurchases, tying buyback authorization to minimum investment thresholds, or taxing buybacks at higher rates would change the calculus of cash distribution. If returning cash to shareholders becomes expensive or legally complex, reinvestment becomes relatively more attractive.
The limitation is that money is water; it finds every crack. Special dividends accomplish similar goals. Acquisitions recycle cash while consolidating market power. Policy must anticipate the detours before building the roadblock.
But the goal isn't to eliminate shareholder returns. It's to change the relative attractiveness of productive investment versus financial distribution. Tilt the incentives, and behavior follows.
The fourth is governance reform.
This addresses the root cause: the objective function of the corporation itself.
Stakeholder representation on corporate boards, following Germany's codetermination model where worker representatives hold up to half of supervisory board seats. Executive compensation tied to investment levels, wage growth, or long-term value creation rather than short-term stock price. Expansion of fiduciary duty beyond shareholders to include workers, communities, and long-term sustainability. The UK's Section 172 points the direction, even if its enforcement remains weak.
This is a project measured in decades, not legislative sessions. But the ideology was also built over decades. Reversing it requires the same patience and persistence that built it.
The hard truth is that the circuit was constructed over forty years through deliberate American policy choices, from SEC rule changes to tax incentives to the ideological capture of business schools and boardrooms. Reversing the circuit requires reversing those choices, not adding tariffs on top.
The failure is not a bug. It is the design. And the design can be changed by the same country that created it.
The Reckoning
We mapped the circuit. So what? What follows from seeing it clearly?
For investors, the stock market is pricing the success of the arbitrage, not the health of the productive economy. This gap can persist for decades until it cannot. When tariffs fail to dent corporate earnings, it is not because American companies are resilient; it is because they have structured themselves to profit from the spread between foreign costs and American prices, and tariffs do not close that spread.
The market is betting the arbitrage continues. If it ever stops, through coordinated policy change, through competitive pressure from other nations, through domestic political upheaval, the repricing will be severe.
For workers, the message is stark but clarifying.
You are not losing to Chinese workers. You are losing to an ideology that treats all workers, in Ohio and Zhengzhou alike, as costs to be minimized. The American worker who lost her factory job and the Chinese worker who took it have something in common: neither captured the value their labor created. The productivity gains flowed through the circuit to its terminal node: shareholder payouts.
The trade war framing guided you to blame workers on the other side of the Pacific. The people who benefit from the circuit were happy to let you.
For policymakers, tariffs target the wrong problem. Until you address the ideology that governs corporate behavior (the ownership of intangibles, the structure of multinational profit allocation, the incentives driving executive decisions), you are treating symptoms while the disease progresses.
The prescriptions are obvious in concept, if not in practice: transparency, coordinated taxation, buyback constraints, governance reform. These are American policies addressing American problems. The question of political will is another matter—but at least the target is now correctly identified.
For citizens, the deepest implication: the nationalist framing (China as aggressor, America as victim) serves those who benefit from the architecture.
The question isn't why China offered cheap labor. Every developing country offers cheap labor. The question is why American policy made it so profitable for American corporations to take that offer and return so little to American workers and communities.
That question has an answer. And the answer is in Washington and Wilmington, not Beijing.
For all of us, tracing the money reveals what the money has replaced.
What left with the factories doesn't fit on a spreadsheet: the feedback loop between production and design, the industrial commons that made America the workshop of the world, the state capacity we discovered was missing when we couldn't make masks in months though we once built ships in weeks.
And something harder to name: the sense of shared enterprise that comes from building things together. The understanding that a corporation is not merely a legal fiction for enriching shareholders, but an institution embedded in a society, with obligations to that society.
The ideology said none of this mattered. Shareholder value was the only value.
The ideology was wrong. We built this machine. We can unbuild it if we first understand what it cost us, and who it served.
Appendix: The Circuit in Practice
Abstractions reveal the architecture, but the circuit is most visible when traced through specific companies. The pattern transcends industry: from consumer electronics to athletic wear to software to pharmaceuticals, the architecture is identical.
Apple is the clearest example.
In Geography #1, Foxconn, Pegatron, and Luxshare assemble iPhones in China under cost-plus arrangements. They own none of the intellectual property. When trade statistics record an iPhone shipped from Shenzhen to Los Angeles, they record it as a Chinese export valued at the full retail price, even though Chinese value-added is a small fraction of that price. The trade deficit captures the gross flow; the profit distribution follows an entirely different path.
In Geography #2, Apple Sales International in Ireland didn't own the patents outright; it owned the economic rights to exploit Apple's IP outside the Americas, purchased through a cost-sharing agreement with Cupertino. This legal fiction allowed ASI to book the profits on every iPhone sold in Europe, Asia, and Africa, despite minimal physical presence. The effective tax rate, as documented by the European Commission, fell to 0.005% by 2014: less than €10 million on €16 billion in profits. The European Commission ruled this arrangement illegal state aid in 2016, a decision contested through years of litigation before the European Court of Justice ultimately upheld it in 2024.11
In Geography #3, foreign earnings accumulated for over a decade, then were repatriated following the TCJA. Their destination was not R&D facilities or manufacturing plants. Their destination was the largest buyback program in corporate history: over $100 billion announced in 2018 alone.
The complete flow: workers assemble iPhones → ASI books profits in Ireland → cash is repatriated → stock buybacks in Cupertino → Tim Cook's net worth rises by millions → the cycle continues.
Who built this machine? Not Beijing. Cupertino.
Microsoft shows the same circuit in digital form.
Microsoft proves the circuit needs no physical goods at all. Software and cloud services flow through the same architecture. Irish affiliates serve as principal profit centers. National subsidiaries around the world function as limited-risk distributors, booking only routine returns. Cloud revenues from Azure are classified as services, but the profits concentrate in low-tax jurisdictions where IP ownership has been assigned.
Irish affiliate dividends run into the tens of billions annually. They finance buyback programs that have exceeded capital expenditure consistently, even as Microsoft invests heavily in data centers to support Azure's growth. The physical investment is real; the financial distribution is larger.
Nike proves the circuit works for brand equity as much as for technology patents.
Production is straightforward: Asian factories in Vietnam and Indonesia manufacture shoes at cost-plus. They own no intellectual property, not the swoosh, not the slogans, not the athlete endorsements. Nike European Operations Netherlands (NEON) holds those intangibles and collects wholesale margins plus brand royalties from sales across the world.
The swoosh is worth more than the shoe it's stitched to.
Accumulated earnings are remitted to the U.S. through intercompany dividends and financing arrangements. The predominant destination: buybacks. Nike has repurchased over $40 billion in shares over the past decade.12 No patents required. Just a logo and a slogan.
Pfizer shows the pharmaceutical variant.
Manufacturing facilities operate at cost-plus in the U.S., Europe, and Asia. Patents and regulatory data, the true value creators in pharmaceuticals, are housed in low-tax affiliates through cost-sharing agreements. National sales subsidiaries receive routine distribution margins only. Patent rents flow to IP-holding entities in Ireland and Luxembourg.
Offshore profits finance acquisitions, internal loans, and shareholder distributions. Same circuit, pharmaceutical version.
Four different industries. Four different products. Same machine.
And in every case, the machine was designed by American executives, enabled by American tax and corporate law, and justified by an American ideology that said this was not merely acceptable but optimal.
References
- Chen, Weikai, Xinyuan Gao, Hao Qi, and Ningzhi He. "The Hidden Role of Multinational Corporations in the U.S.-China Trade Conflict." Working Paper, 2025. ↩
- Butler, Adam. "The Trade Deficit Is a Profit Margin." *The Choice Engine*, December 14, 2025. ↩
- Mauboussin, Michael J., and Dan Callahan. "Capital Allocation: Results, Analysis, and Assessment." Morgan Stanley Counterpoint Global Insights, November 5, 2025. ↩
- OECD. *Transfer Pricing Guidelines for Multinational Enterprises and Tax Administrations 2022*. Paris: OECD Publishing, 2022. Para. 2.59. ↩
- Lazonick, William. "Profits Without Prosperity." *Harvard Business Review*, September 2014. ↩
- Lazonick, William. "The Financialization of the U.S. Corporation: What Has Been Lost, and How It Can Be Regained." *Seattle University Law Review* 36, no. 2 (2013): 857. ↩
- Gereffi, Gary. "Global Value Chains in a Post-Washington Consensus World." *Review of International Political Economy* 21, no. 1 (2014): 9-37. ↩
- Economic Policy Institute. "CEO Pay in 2023: CEO Pay Has Skyrocketed 1,085% Since 1978." EPI Report, 2024. ↩
- These figures come from different data sources and measure different things (trade flows, service receipts, financial distributions). They don't form a closed accounting identity, and profits appear at multiple stages before reaching shareholders. But the orders of magnitude tell a coherent story: the scale of value captured through the arbitrage is large enough to fund the scale of shareholder payouts we observe. ↩
- Hinz, Julian, Aaron Lohmann, Hendrik Mahlkow, and Anna Vorwig. "America's Own Goal: Who Pays the Tariffs?" Kiel Policy Brief No. 201, Kiel Institute for the World Economy, January 2026. ↩
- European Commission. "State Aid: Ireland Gave Illegal Tax Benefits to Apple Worth Up to €13 Billion." Press Release IP/16/2923, August 30, 2016. ↩
- Nike Inc. SEC Filings and Investor Relations. Nike has authorized multiple share repurchase programs, including an $8 billion program in 2014 and an $18 billion program announced in 2022, with cumulative repurchases exceeding $40 billion over the past decade. ↩


