[PANOPTICA EDITOR'S NOTE]
Peter Atwater's framework for understanding decision-making through confidence and control has become essential for reading real-time political and market-driven behavior. In his book The Confidence Map: Charting a Path from Chaos to Clarity, Atwater explains how certainty and control determine both beliefs and ensuing actions.
In early 2026, as narratives around presidential legitimacy and authority have shifted dramatically, we couldn't help but notice Peter's piece republished below, and just how strongly his maps aligned with information we're seeing in the Panoptica Politics Storyboards. His piece, with Panoptica's supporting data, reveals the real organizing principle of the current political moment.
PETER ATWATER'S FRAMEWORK
While others consider the geographic chessboard, I'd offer that the one that really matters is the one below, given that our location on the Confidence Map drives the choices we and others make.
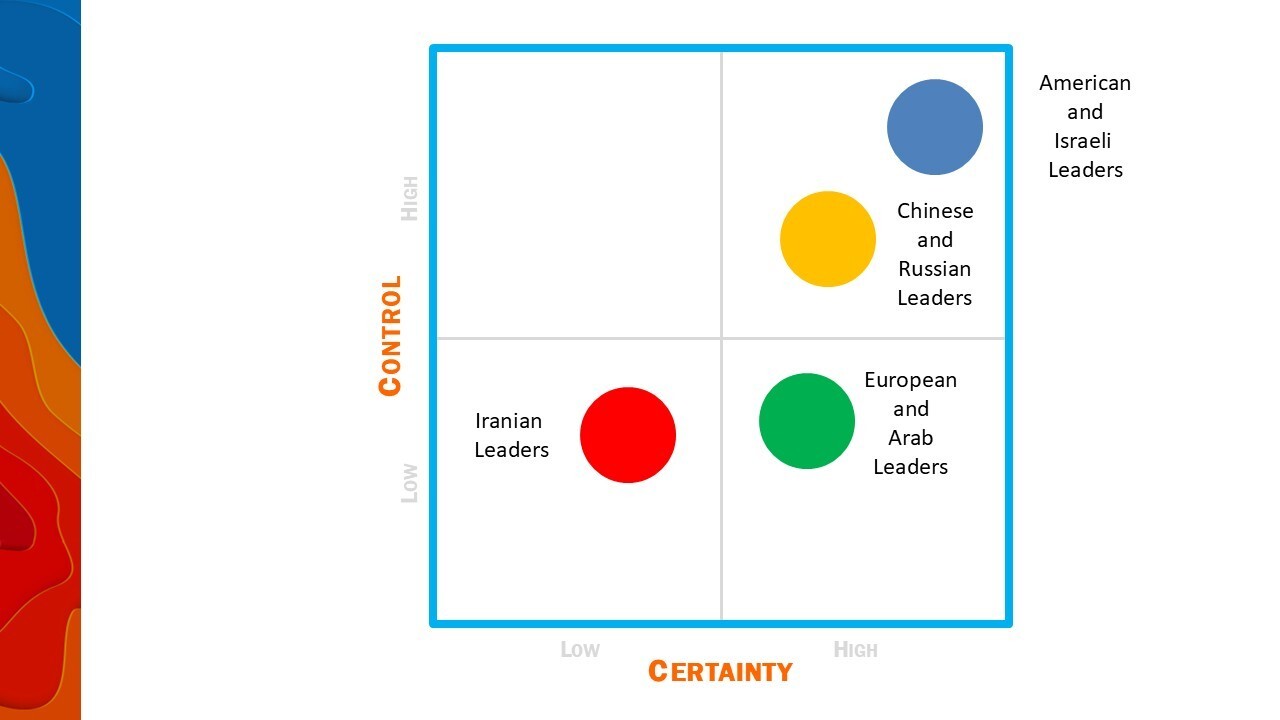
As we move ahead, I strongly encourage you to consider not only the location of the key decision-makers, but their direction of movement. Do they feel more or less certain than yesterday? Do they feel more or less in control? What will this lead them to do next?
Finally, I would encourage you to consider other groups whose mood may weigh heavily on key decision-makers. How will changes in their position influence what unfolds next?
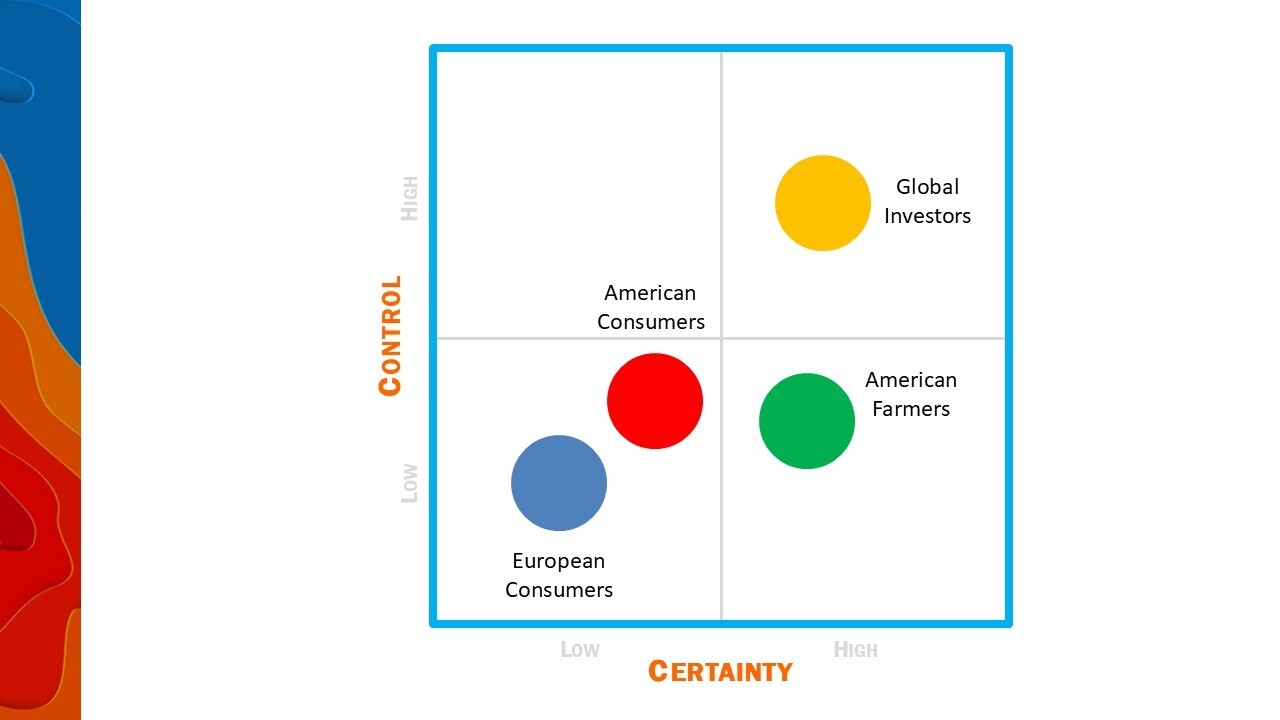
As my students' research shows over and over, wars are political events are social experiences. Mood drives the decision-making. And nowhere is the scenario planning easier to play out than on the Confidence Quadrant.
Finally, if you are still unfamiliar with the framework and the many ways our feelings of certainty and control drive decision-making, here's the link to my book, The Confidence Map.
HOW THIS IS PLAYING OUT: MARCH 2026
.png&w=3840&q=100)
EDITOR'S NOTE:
When Trump threatened to invoke emergency powers to nationalize elections (late February–early March 2026), the Storyboard tracking "The White House is exceeding its authority" accelerated sharply higher. It's indicative that narratives about the executive branch pushing boundaries have intensified. But as Atwater asks: which direction are they moving next? Depending where you sit on the map, the same action registers as either strength or overreach. The data shows both interpretations are present and elevated simultaneously.
EDITOR'S NOTE:
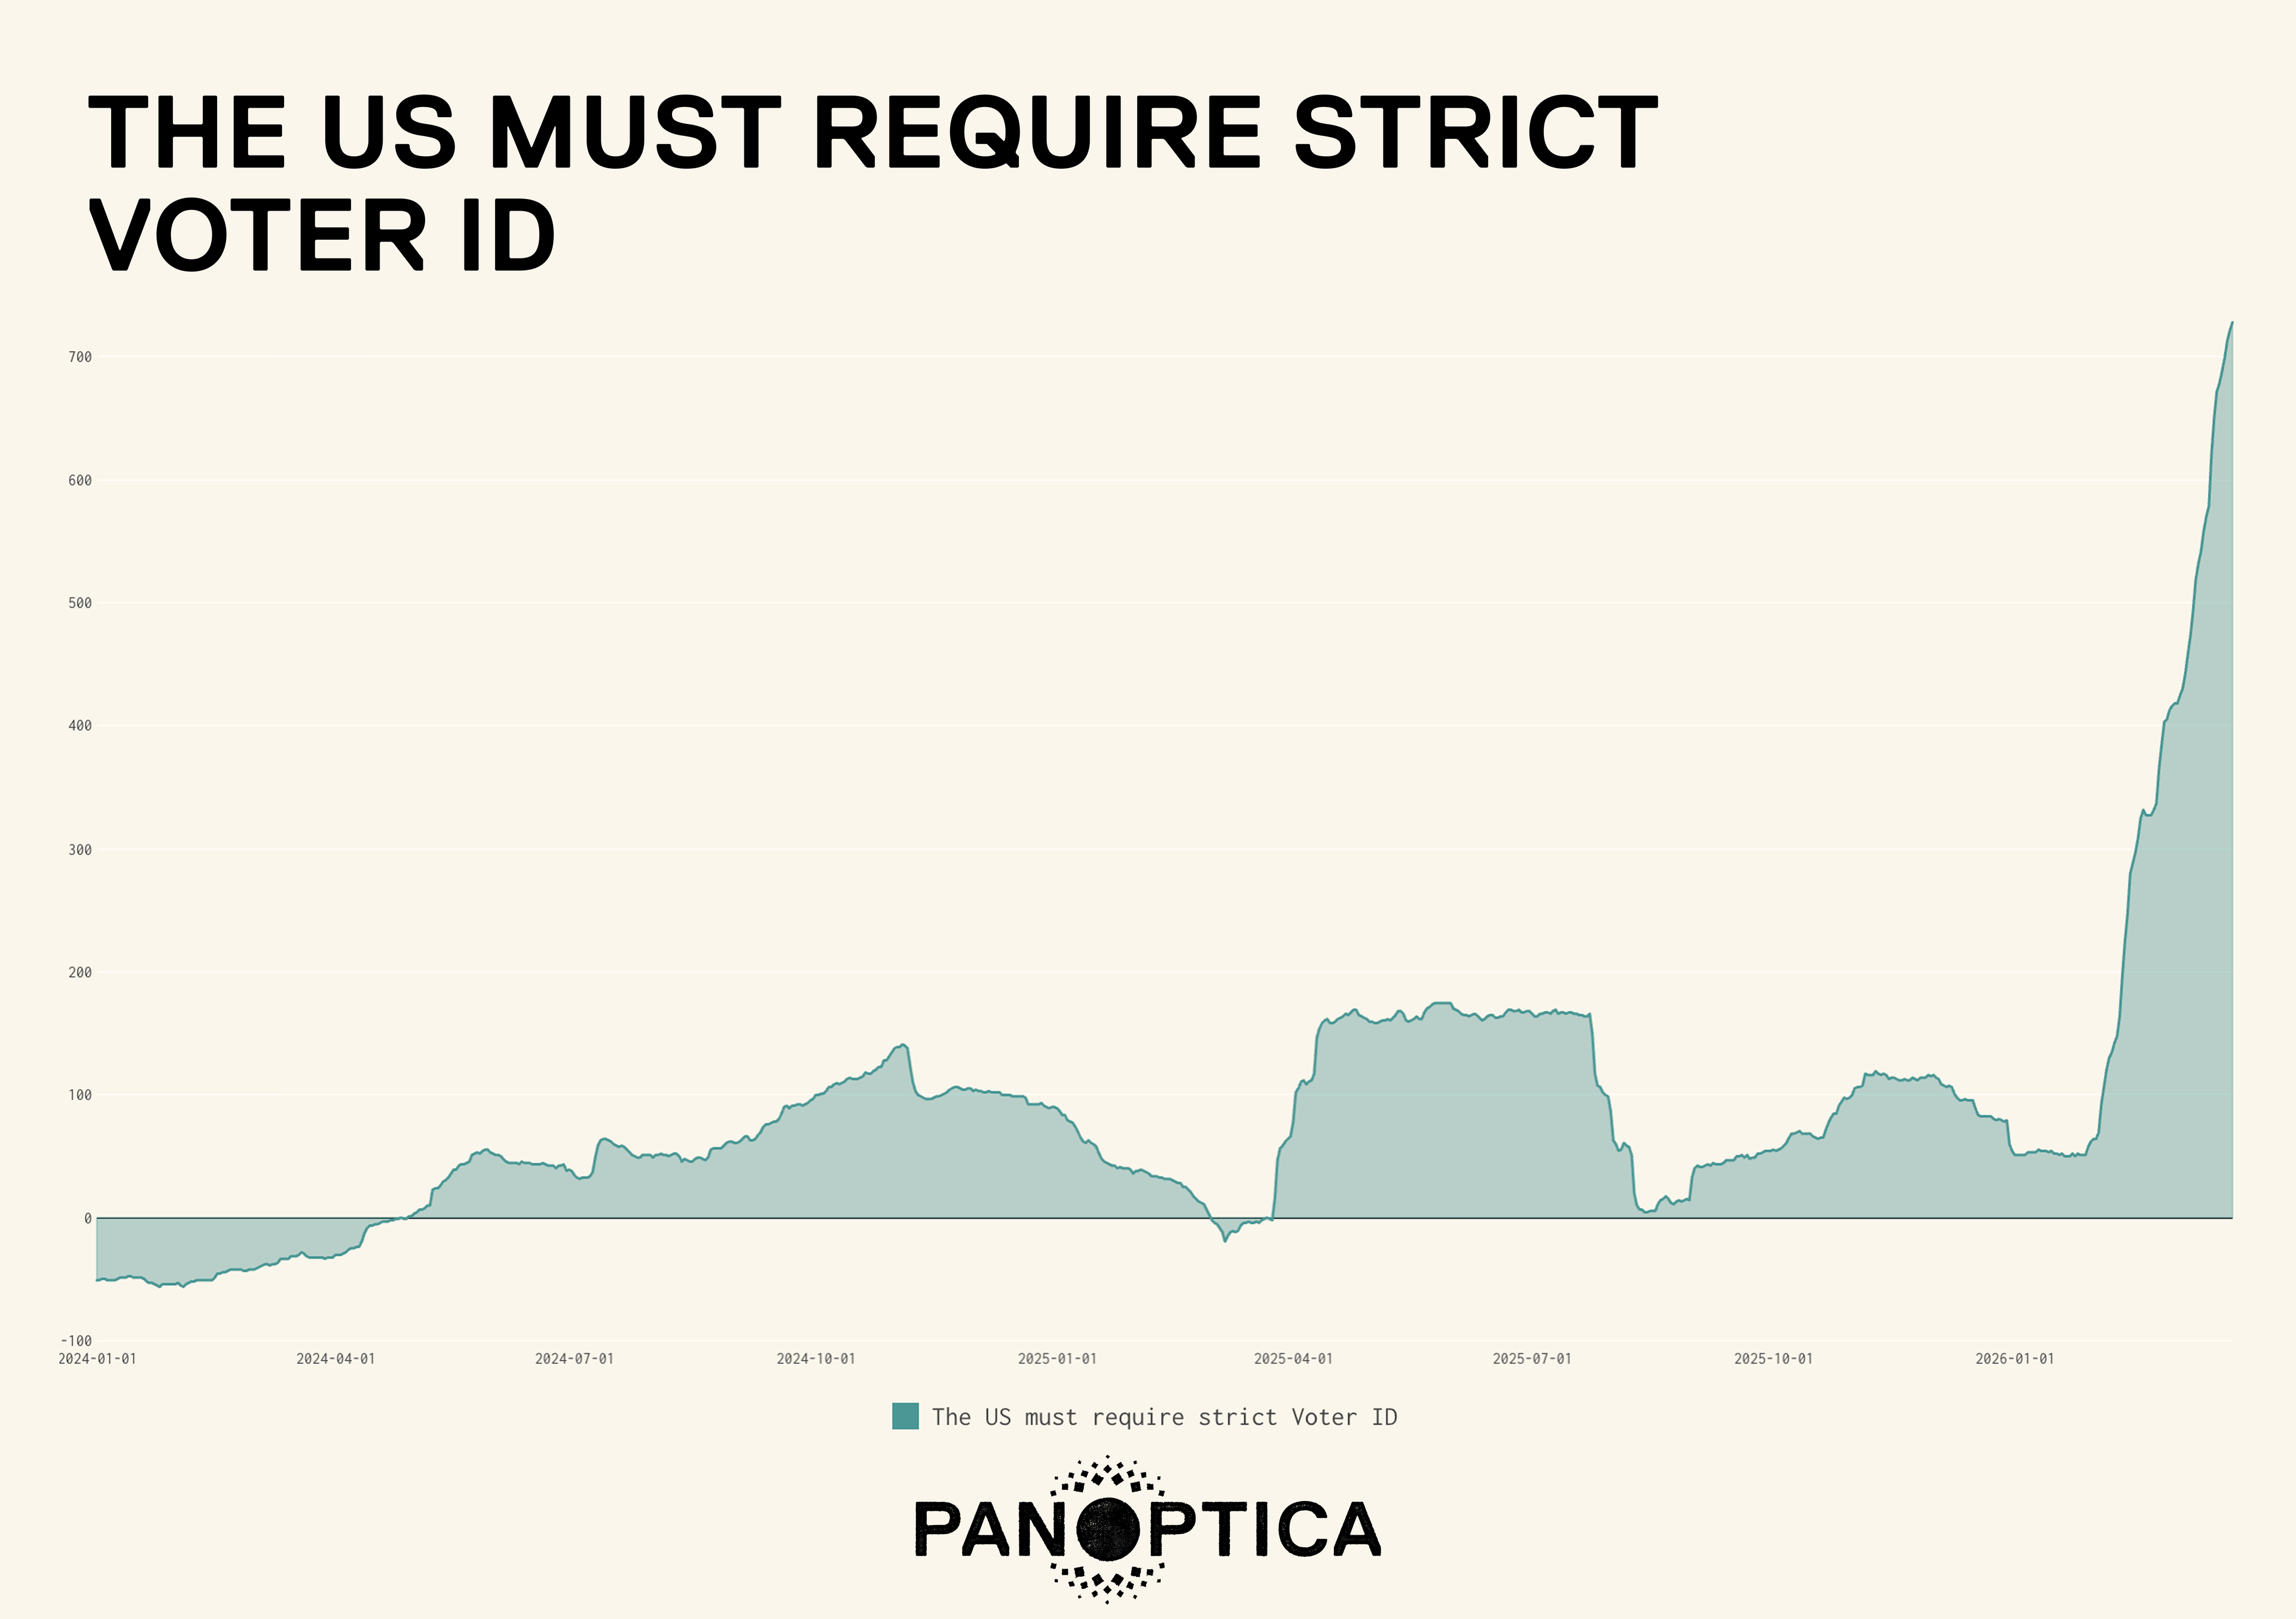
The Storyboard tracking "The US must require strict Voter ID" is the highest among Politics readings right now. But the real story is in the direction. As Atwater emphasizes, you need to know which way they're moving, not just where they sit. The consolidation acceleration in the most recent weeks shows Atwater's upper right quadrant is moving deeper into high certainty and high control. At some point, if the momentum shifts, what would reverse this? The data suggests considerable room below if that happens.
EDITOR'S NOTE:
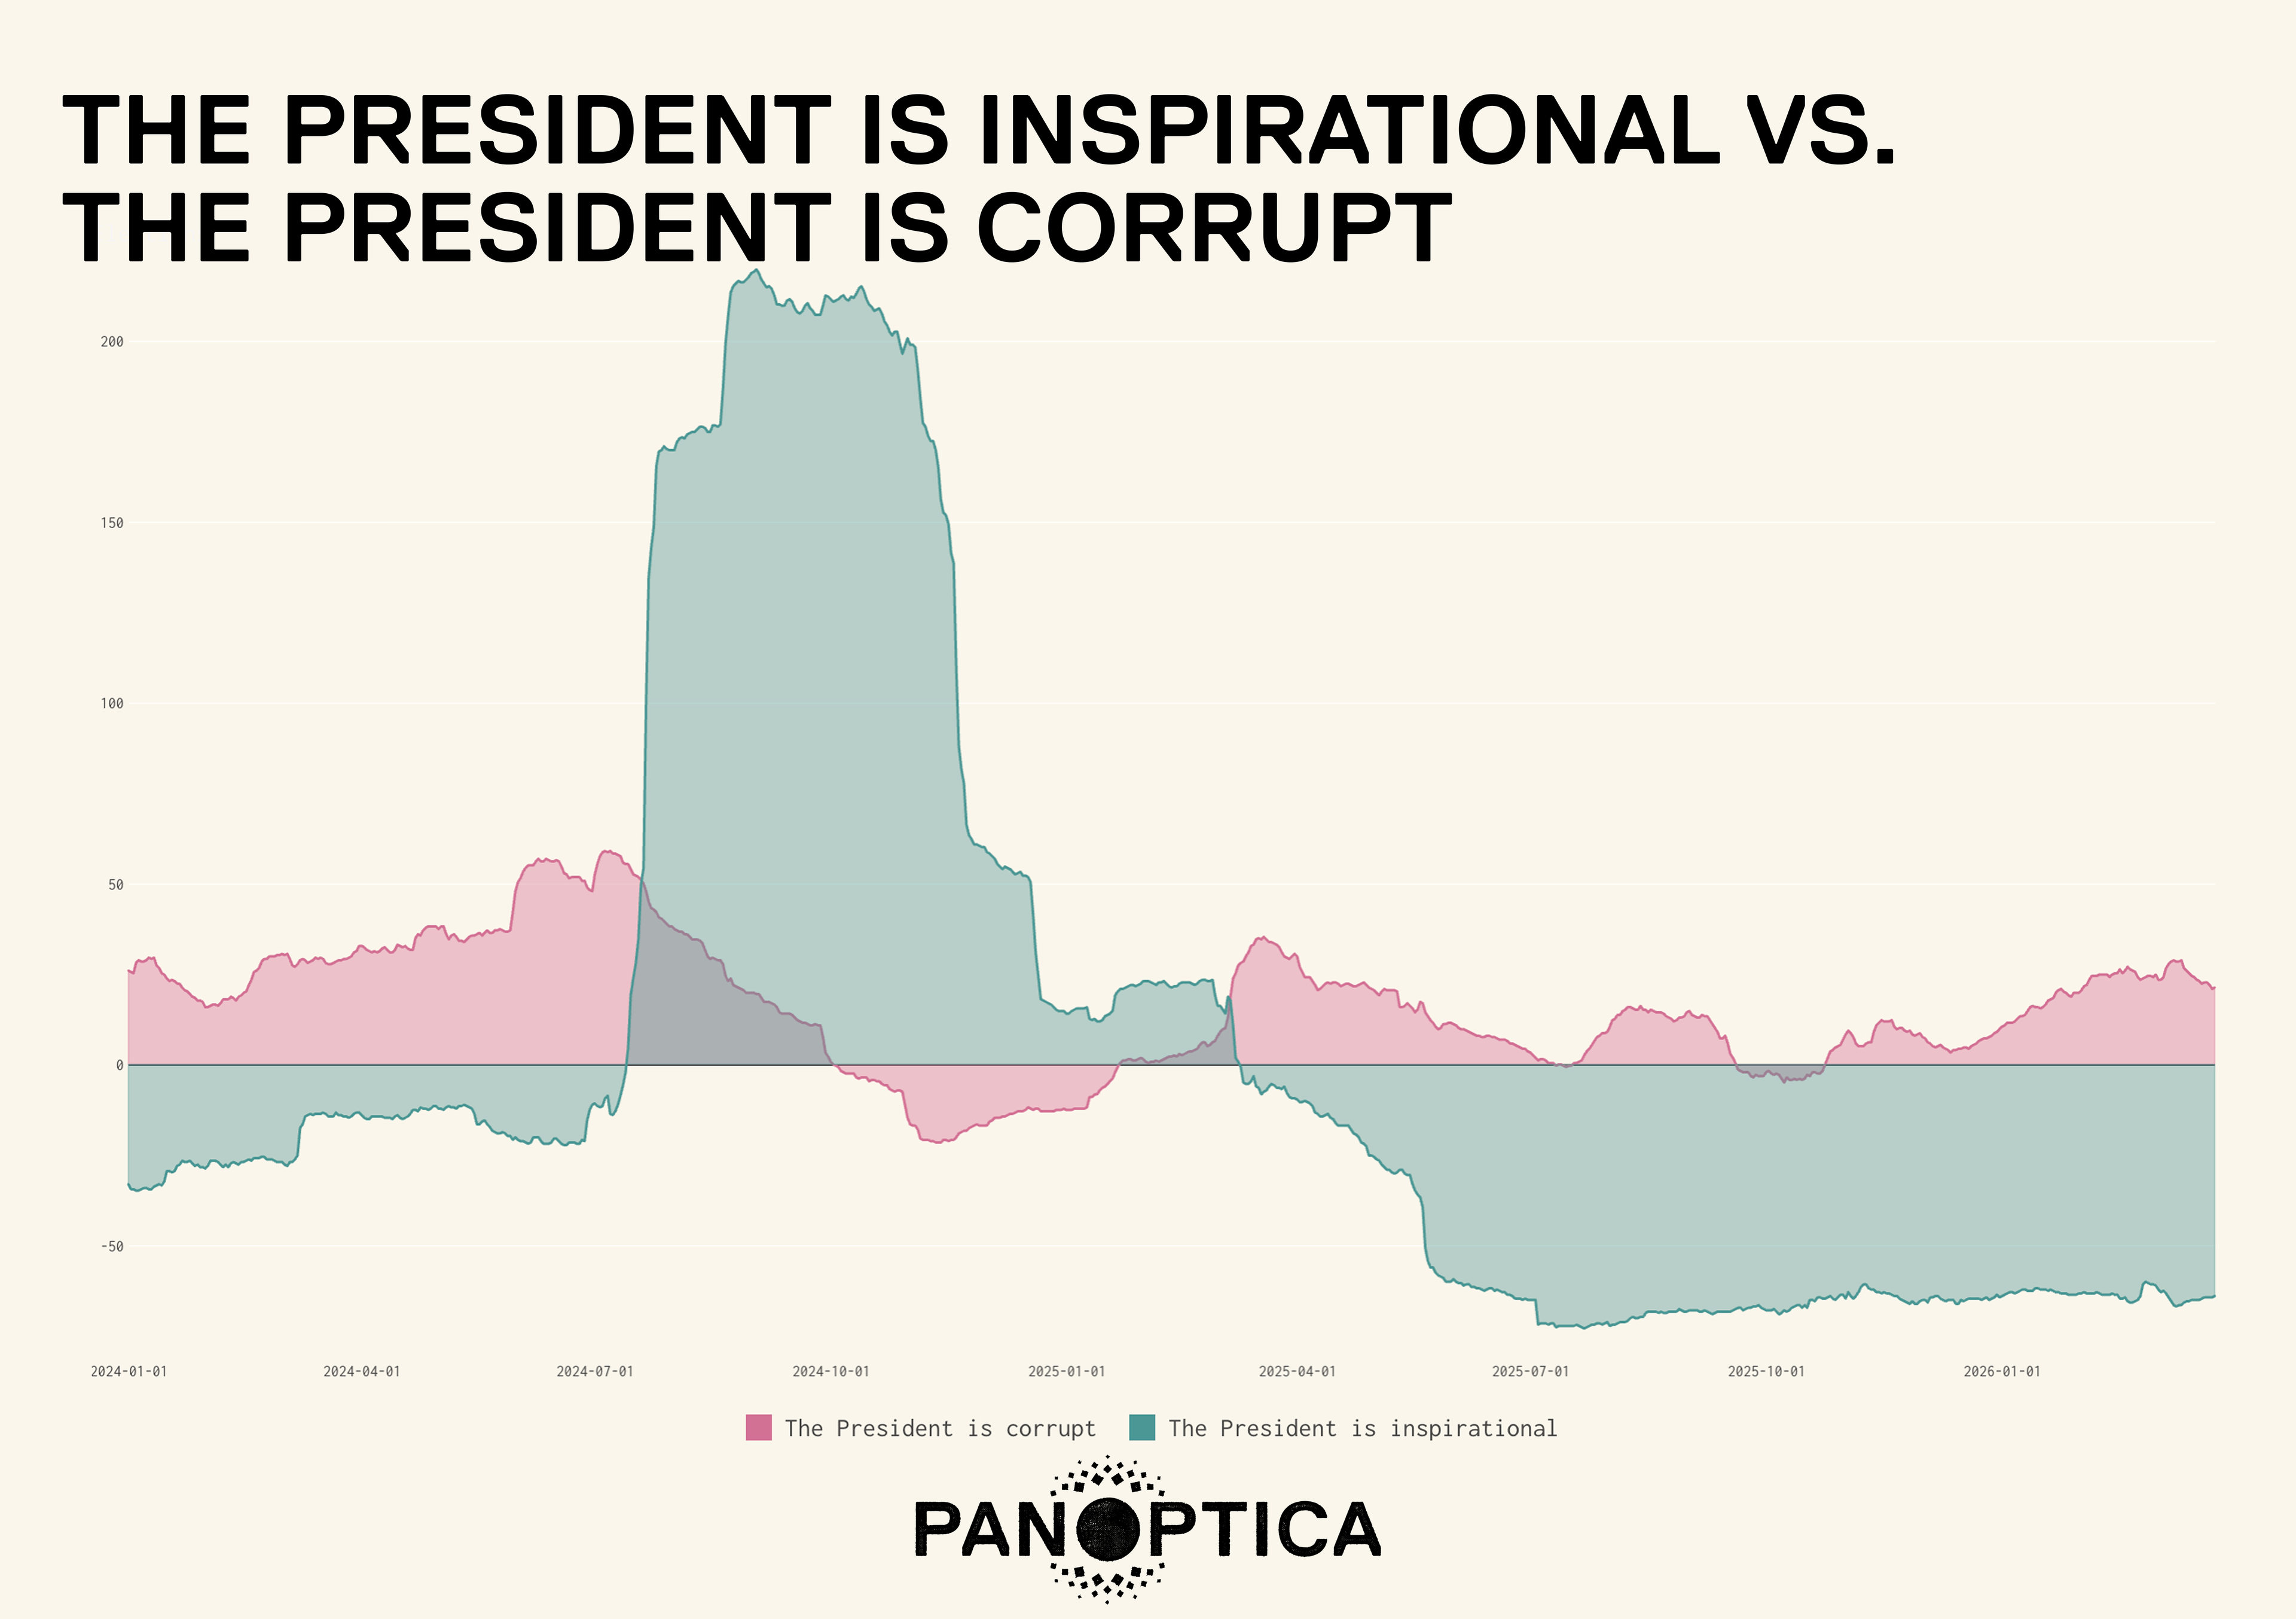
This chart maps where leaders and consumers might move within Atwater's Confidence Quadrants. When we look at two Storyboards about the president and how they've moved over the recent period, "The President is inspirational" has fallen out of narrative space entirely, reading below zero and staying there. Meanwhile, "The President is corrupt" has remained somewhat elevated, notably without a spike as of now. The contradiction feels stark. With one framing of the president absent from headlines and the other middling, the aspirational narrative no longer competes in the story Americans are telling about their leader.